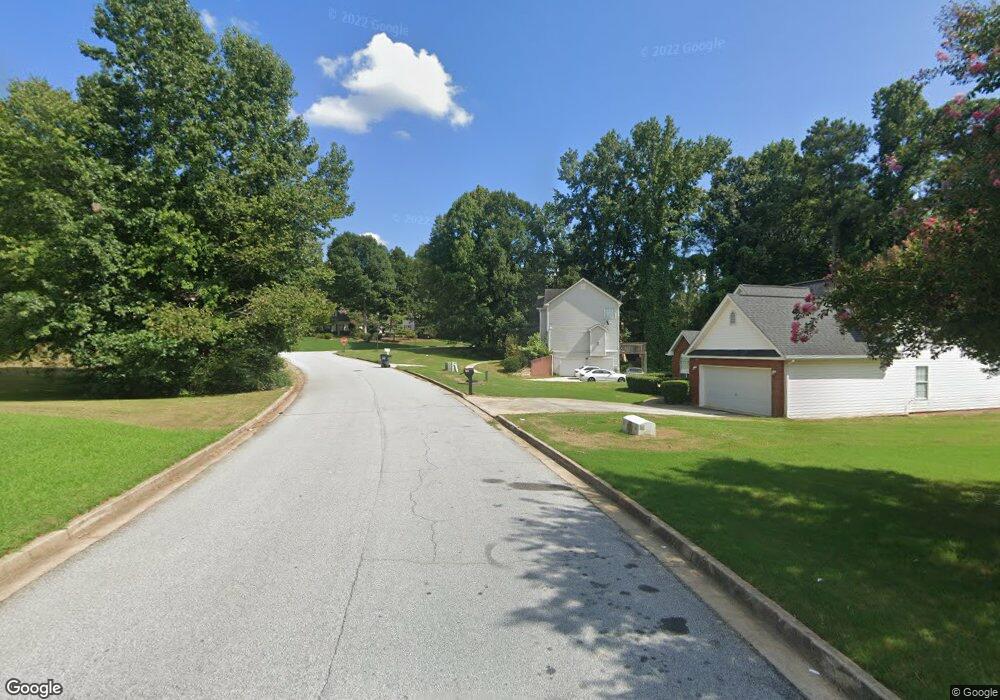
230 Camerons Way Covington, GA 30016
Estimated Value: $296,000 - $335,000
3
Beds
2
Baths
2,031
Sq Ft
$152/Sq Ft
Est. Value
About This Home
This home is located at 230 Camerons Way, Covington, GA 30016 and is currently estimated at $308,786, approximately $152 per square foot. 230 Camerons Way is a home located in Newton County with nearby schools including Newton County Theme School at Ficquett, Clements Middle School, and Newton High School.
Ownership History
Date
Name
Owned For
Owner Type
Purchase Details
Closed on
Jun 26, 2025
Sold by
Bryan Stanley
Bought by
Bryan Asset Protection Trust and Bryan Stanley Raphael Jr Tr
Current Estimated Value
Purchase Details
Closed on
Jan 27, 2009
Sold by
Residential Funding Corp
Bought by
Inniss Mark N
Home Financials for this Owner
Home Financials are based on the most recent Mortgage that was taken out on this home.
Original Mortgage
$70,400
Interest Rate
5.08%
Mortgage Type
New Conventional
Purchase Details
Closed on
Aug 5, 2008
Sold by
Wandrie Marc
Bought by
Residential Funding Corp
Purchase Details
Closed on
May 31, 2005
Sold by
Tenner Rafeeal L
Bought by
Wandrie Mac
Home Financials for this Owner
Home Financials are based on the most recent Mortgage that was taken out on this home.
Original Mortgage
$160,500
Interest Rate
7.85%
Mortgage Type
New Conventional
Purchase Details
Closed on
Nov 13, 2001
Sold by
Rivenbark Kathleen F
Bought by
Tenner Rafeeal L
Home Financials for this Owner
Home Financials are based on the most recent Mortgage that was taken out on this home.
Original Mortgage
$132,335
Interest Rate
10.95%
Mortgage Type
New Conventional
Create a Home Valuation Report for This Property
The Home Valuation Report is an in-depth analysis detailing your home's value as well as a comparison with similar homes in the area
Home Values in the Area
Average Home Value in this Area
Purchase History
| Date | Buyer | Sale Price | Title Company |
|---|---|---|---|
| Bryan Asset Protection Trust | -- | -- | |
| Inniss Mark N | $88,000 | -- | |
| Residential Funding Corp | $124,865 | -- | |
| Wandrie Mac | $161,000 | -- | |
| Tenner Rafeeal L | $139,300 | -- |
Source: Public Records
Mortgage History
| Date | Status | Borrower | Loan Amount |
|---|---|---|---|
| Previous Owner | Inniss Mark N | $70,400 | |
| Previous Owner | Wandrie Mac | $160,500 | |
| Previous Owner | Tenner Rafeeal L | $132,335 |
Source: Public Records
Tax History Compared to Growth
Tax History
| Year | Tax Paid | Tax Assessment Tax Assessment Total Assessment is a certain percentage of the fair market value that is determined by local assessors to be the total taxable value of land and additions on the property. | Land | Improvement |
|---|---|---|---|---|
| 2024 | $3,311 | $128,760 | $15,200 | $113,560 |
| 2023 | $3,577 | $130,000 | $7,200 | $122,800 |
| 2022 | $2,553 | $92,240 | $7,200 | $85,040 |
| 2021 | $2,375 | $76,680 | $7,200 | $69,480 |
| 2020 | $2,409 | $70,240 | $7,200 | $63,040 |
| 2019 | $1,297 | $65,800 | $7,200 | $58,600 |
| 2018 | $1,223 | $63,400 | $7,200 | $56,200 |
| 2017 | $917 | $54,480 | $7,200 | $47,280 |
| 2016 | $781 | $50,520 | $5,600 | $44,920 |
| 2015 | $1,609 | $45,400 | $5,600 | $39,800 |
| 2014 | $1,535 | $43,400 | $0 | $0 |
Source: Public Records
Map
Nearby Homes
- 310 Camerons Way
- 80 Rosewood Cir
- 210 Camerons Way
- 225 Camerons Way
- 25 Camerons Terrace Unit 5
- 90 Rosewood Cir
- 35 Camerons Terrace
- 215 Camerons Way Unit 3
- 55 Landing Ln
- 200 Camerons Way
- 50 Rosewood Cir
- 55 Rosewood Cir
- 100 Rosewood Cir
- 45 Landing Ln
- 60 Rosewood Cir
- 0 Rosewood Cir Unit 7531535
- 0 Rosewood Cir Unit 7406140
- 0 Rosewood Cir Unit 7193096
- 0 Rosewood Cir Unit 7150247
- 0 Rosewood Cir Unit 7014518