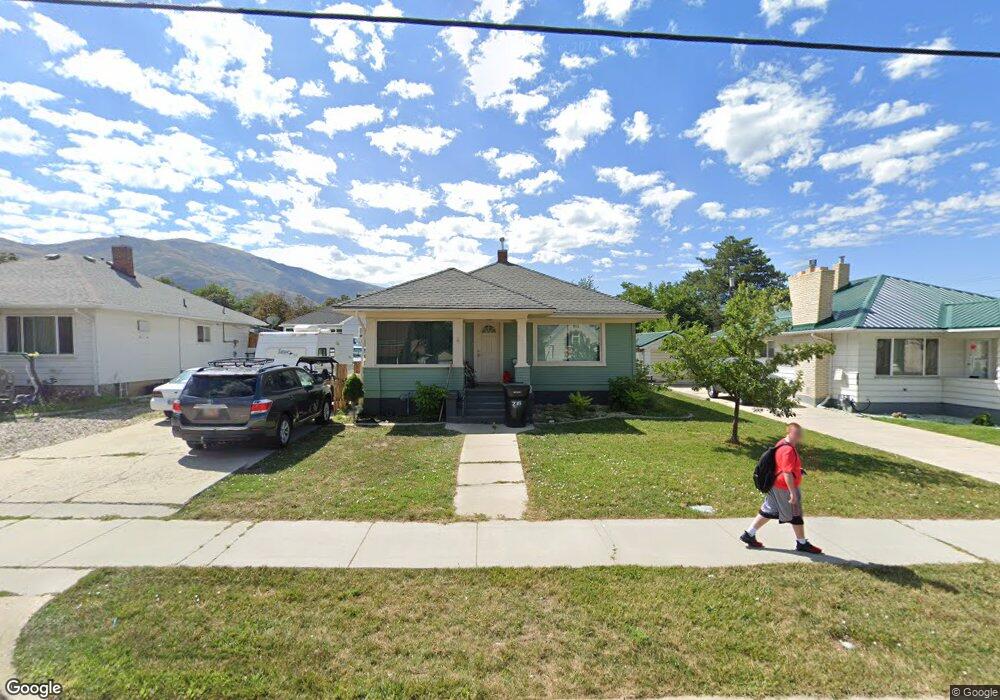
230 E 100 N Brigham City, UT 84302
Estimated Value: $350,506 - $369,000
4
Beds
1
Bath
1,788
Sq Ft
$201/Sq Ft
Est. Value
About This Home
This home is located at 230 E 100 N, Brigham City, UT 84302 and is currently estimated at $359,877, approximately $201 per square foot. 230 E 100 N is a home located in Box Elder County with nearby schools including Golden Spike Elementary, Box Elder Middle School, and Adele C. Young Intermediate School.
Ownership History
Date
Name
Owned For
Owner Type
Purchase Details
Closed on
Apr 28, 2020
Sold by
Blck Llc
Bought by
Hackwell Hunter
Current Estimated Value
Home Financials for this Owner
Home Financials are based on the most recent Mortgage that was taken out on this home.
Original Mortgage
$233,197
Outstanding Balance
$206,997
Interest Rate
3.62%
Mortgage Type
FHA
Estimated Equity
$152,880
Purchase Details
Closed on
Feb 24, 2006
Sold by
Bignell Amber and Bignell John
Bought by
Bignell Amber and Bignell John
Home Financials for this Owner
Home Financials are based on the most recent Mortgage that was taken out on this home.
Original Mortgage
$21,000
Interest Rate
6.08%
Mortgage Type
Stand Alone Second
Purchase Details
Closed on
Nov 10, 2005
Sold by
Tree Lance E
Bought by
Peck Realty Inc
Create a Home Valuation Report for This Property
The Home Valuation Report is an in-depth analysis detailing your home's value as well as a comparison with similar homes in the area
Purchase History
| Date | Buyer | Sale Price | Title Company |
|---|---|---|---|
| Hackwell Hunter | -- | Us Title Ins Urance Agcy | |
| Bignell Amber | -- | None Available | |
| Peck Realty Inc | -- | None Available |
Source: Public Records
Mortgage History
| Date | Status | Borrower | Loan Amount |
|---|---|---|---|
| Open | Hackwell Hunter | $233,197 | |
| Previous Owner | Bignell Amber | $21,000 | |
| Previous Owner | Bignell Amber | $84,000 |
Source: Public Records
Tax History
| Year | Tax Paid | Tax Assessment Tax Assessment Total Assessment is a certain percentage of the fair market value that is determined by local assessors to be the total taxable value of land and additions on the property. | Land | Improvement |
|---|---|---|---|---|
| 2025 | $1,991 | $342,453 | $104,250 | $238,203 |
| 2024 | $1,745 | $335,961 | $99,250 | $236,711 |
| 2023 | $1,813 | $357,332 | $94,250 | $263,082 |
| 2022 | $1,796 | $180,965 | $21,588 | $159,377 |
| 2021 | $1,446 | $213,583 | $39,250 | $174,333 |
| 2020 | $1,315 | $213,583 | $39,250 | $174,333 |
| 2019 | $1,231 | $106,440 | $21,588 | $84,852 |
| 2018 | $1,110 | $95,373 | $21,588 | $73,785 |
| 2017 | $965 | $143,593 | $16,500 | $113,593 |
| 2016 | $1,010 | $76,001 | $16,500 | $59,501 |
| 2015 | $938 | $70,592 | $16,500 | $54,092 |
| 2014 | $938 | $68,016 | $16,500 | $51,516 |
| 2013 | -- | $68,016 | $16,500 | $51,516 |
Source: Public Records
Map
Nearby Homes
Your Personal Tour Guide
Ask me questions while you tour the home.