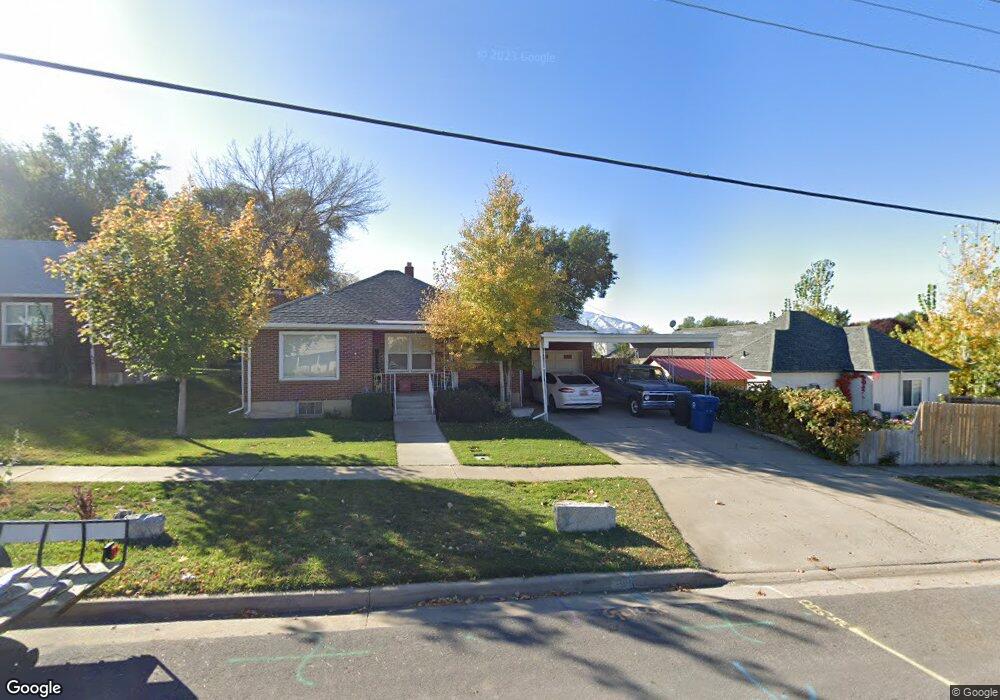
230 E 300 S Spanish Fork, UT 84660
Estimated Value: $376,000 - $389,166
3
Beds
2
Baths
1,990
Sq Ft
$192/Sq Ft
Est. Value
About This Home
This home is located at 230 E 300 S, Spanish Fork, UT 84660 and is currently estimated at $382,389, approximately $192 per square foot. 230 E 300 S is a home located in Utah County with nearby schools including Canyon Elementary School, Spanish Fork Jr High School, and Spanish Fork High School.
Ownership History
Date
Name
Owned For
Owner Type
Purchase Details
Closed on
Nov 21, 2020
Sold by
Daily Christopher B
Bought by
Amadon Joseph M and Amadon Patricia A
Current Estimated Value
Purchase Details
Closed on
Jan 19, 2016
Sold by
Daily Christopher B
Bought by
Daily Christopher
Home Financials for this Owner
Home Financials are based on the most recent Mortgage that was taken out on this home.
Original Mortgage
$155,000
Interest Rate
3.92%
Mortgage Type
New Conventional
Purchase Details
Closed on
Mar 20, 2014
Sold by
Forsey Larry and Forsey Roger
Bought by
Daily Christopher B
Home Financials for this Owner
Home Financials are based on the most recent Mortgage that was taken out on this home.
Original Mortgage
$154,400
Interest Rate
4.4%
Mortgage Type
FHA
Create a Home Valuation Report for This Property
The Home Valuation Report is an in-depth analysis detailing your home's value as well as a comparison with similar homes in the area
Home Values in the Area
Average Home Value in this Area
Purchase History
| Date | Buyer | Sale Price | Title Company |
|---|---|---|---|
| Amadon Joseph M | -- | None Available | |
| Daily Christopher | -- | Access Title Company | |
| Daily Christopher B | -- | Security Title And Abstract |
Source: Public Records
Mortgage History
| Date | Status | Borrower | Loan Amount |
|---|---|---|---|
| Previous Owner | Daily Christopher | $155,000 | |
| Previous Owner | Daily Christopher B | $154,400 |
Source: Public Records
Tax History
| Year | Tax Paid | Tax Assessment Tax Assessment Total Assessment is a certain percentage of the fair market value that is determined by local assessors to be the total taxable value of land and additions on the property. | Land | Improvement |
|---|---|---|---|---|
| 2025 | $1,558 | $184,360 | -- | -- |
| 2024 | $1,558 | $160,545 | $0 | $0 |
| 2023 | $1,524 | $157,300 | $0 | $0 |
| 2022 | $1,792 | $181,335 | $0 | $0 |
| 2021 | $1,568 | $253,800 | $72,400 | $181,400 |
| 2020 | $1,421 | $223,700 | $60,300 | $163,400 |
| 2019 | $1,245 | $206,100 | $60,300 | $145,800 |
| 2018 | $1,169 | $187,100 | $60,300 | $126,800 |
| 2017 | $1,082 | $93,115 | $0 | $0 |
| 2016 | $898 | $76,230 | $0 | $0 |
| 2015 | $816 | $68,475 | $0 | $0 |
| 2014 | $749 | $63,030 | $0 | $0 |
Source: Public Records
Map
Nearby Homes
- 390 S 300 E
- 844 S 200 E Unit 4 -201
- 296 S St Unit 20
- 324 S St Unit 204
- 573 E 300 S
- 135 E 100 N
- 2583 E 300 S Unit 21
- 837 S 200 E Unit 5-303
- 837 S 200 E Unit 5-201
- 837 S 200 E Unit 5-301
- 134 W 700 S
- 277 S 700 E
- 721 S 110 W
- 272 E 850 S Unit 7-204
- 272 E 850 S Unit 7-203
- 272 E 850 S Unit 7-201
- 272 E 850 S Unit 7-304
- 216 E 850 S Unit 6-204
- 733 S 170 W
- 691 S 260 W
Your Personal Tour Guide
Ask me questions while you tour the home.