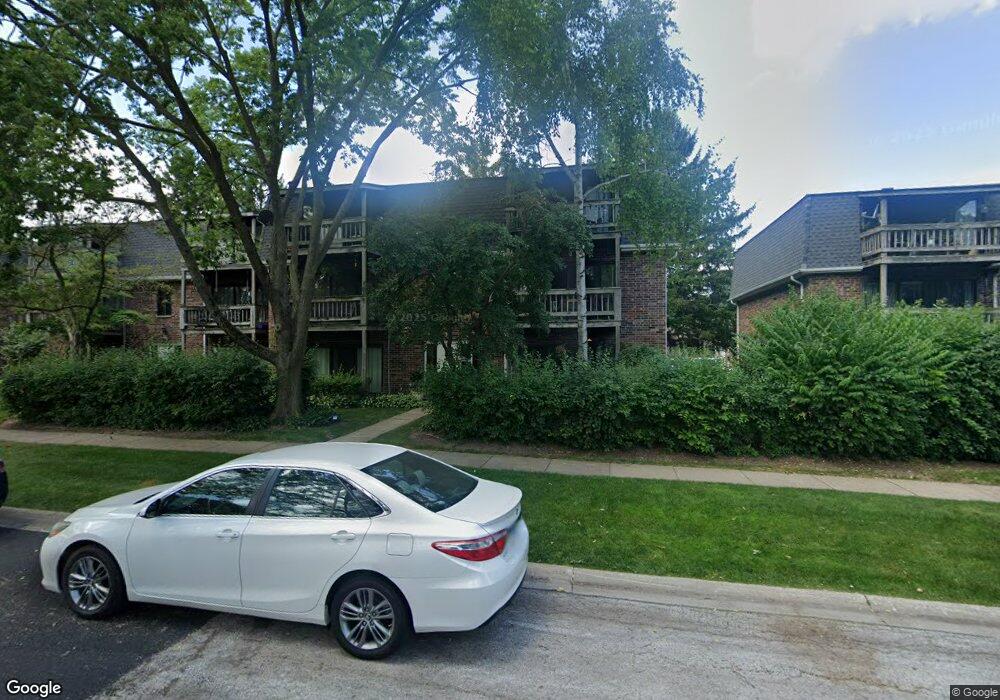
230 E Court of Shorewood Unit 2 Vernon Hills, IL 60061
Estimated Value: $184,535 - $206,000
--
Bed
1
Bath
942
Sq Ft
$204/Sq Ft
Est. Value
About This Home
This home is located at 230 E Court of Shorewood Unit 2, Vernon Hills, IL 60061 and is currently estimated at $191,884, approximately $203 per square foot. 230 E Court of Shorewood Unit 2 is a home located in Lake County with nearby schools including Country Meadows Elementary School, Woodlawn Middle School, and Adlai E Stevenson High School.
Ownership History
Date
Name
Owned For
Owner Type
Purchase Details
Closed on
Aug 10, 2023
Sold by
Quintero Raul and Quintero Sharon
Bought by
Quintero Raquel
Current Estimated Value
Purchase Details
Closed on
Jun 30, 2003
Sold by
Valencia Juan C
Bought by
Quintero Raul and Quintero Sharon
Purchase Details
Closed on
Jan 18, 2003
Sold by
Valencia Juan C and Sanchez Odilia
Bought by
Valencia Juan C
Purchase Details
Closed on
Aug 2, 2000
Sold by
Terrault Judyann
Bought by
Valencia Juan C and Sanchez Odila
Home Financials for this Owner
Home Financials are based on the most recent Mortgage that was taken out on this home.
Original Mortgage
$81,050
Interest Rate
8.15%
Mortgage Type
FHA
Purchase Details
Closed on
Mar 31, 1994
Sold by
Soussa Aphrodite
Bought by
Terrault Judyann
Home Financials for this Owner
Home Financials are based on the most recent Mortgage that was taken out on this home.
Original Mortgage
$49,200
Interest Rate
7.35%
Create a Home Valuation Report for This Property
The Home Valuation Report is an in-depth analysis detailing your home's value as well as a comparison with similar homes in the area
Home Values in the Area
Average Home Value in this Area
Purchase History
| Date | Buyer | Sale Price | Title Company |
|---|---|---|---|
| Quintero Raquel | -- | None Listed On Document | |
| Quintero Raul | $119,000 | -- | |
| Valencia Juan C | -- | -- | |
| Valencia Juan C | $84,000 | -- | |
| Terrault Judyann | $41,000 | -- |
Source: Public Records
Mortgage History
| Date | Status | Borrower | Loan Amount |
|---|---|---|---|
| Previous Owner | Valencia Juan C | $81,050 | |
| Previous Owner | Terrault Judyann | $49,200 |
Source: Public Records
Tax History Compared to Growth
Tax History
| Year | Tax Paid | Tax Assessment Tax Assessment Total Assessment is a certain percentage of the fair market value that is determined by local assessors to be the total taxable value of land and additions on the property. | Land | Improvement |
|---|---|---|---|---|
| 2024 | $4,371 | $50,632 | $13,147 | $37,485 |
| 2023 | $3,988 | $44,236 | $11,486 | $32,750 |
| 2022 | $3,988 | $40,425 | $10,496 | $29,929 |
| 2021 | $3,855 | $39,989 | $10,383 | $29,606 |
| 2020 | $3,770 | $40,125 | $10,418 | $29,707 |
| 2019 | $4,091 | $44,558 | $10,380 | $34,178 |
| 2018 | $2,672 | $29,963 | $11,282 | $18,681 |
| 2017 | $2,637 | $29,264 | $11,019 | $18,245 |
| 2016 | $2,546 | $28,023 | $10,552 | $17,471 |
| 2015 | $2,508 | $26,207 | $9,868 | $16,339 |
| 2014 | $2,892 | $29,921 | $10,599 | $19,322 |
| 2012 | $2,879 | $29,981 | $10,620 | $19,361 |
Source: Public Records
Map
Nearby Homes
- 229 W Court of Shorewood Unit 3B
- 239 W Ct of Shorewood Unit 1B
- 835 Waterview Cir Unit 4
- 835 Waterview Cir Unit 2
- 820 N Lakeside Dr Unit 2D
- 126 S Fiore Pkwy
- 717 N Lakeside Dr
- 67 Shelby Ct
- 713 N Lakeside Dr
- 210 E Lakeside Dr
- 0 Endwood Dr
- 6421 Collier Cir
- 35 Charles Ct
- 54 N Royal Oak Dr
- 234 Us Highway 45
- 7215 Daybreak Ln
- 291 Hunter Ct
- 190 Southgate Dr
- 1062 Dearborn Ln
- 349 W Pointe Dr
- 230 E Court of Shorewood Unit 5
- 230 E Court of Shorewood Unit 4
- 230 E Court of Shorewood Unit 3
- 230 E Court of Shorewood Unit 1
- 230 E Court of Shorewood Unit 6
- 209 W Court of Shorewood Unit 2B
- 209 W Court of Shorewood Unit 1A
- 209 W Court of Shorewood Unit 1B
- 209 W Court of Shorewood Unit 3B
- 209 W Court of Shorewood Unit 3A
- 209 W Court of Shorewood Unit 2A
- 220 E Court of Shorewood Unit 5
- 220 E Court of Shorewood Unit 4
- 220 E Court of Shorewood Unit 3
- 220 E Court of Shorewood Unit 2
- 220 E Court of Shorewood Unit 1
- 210 E Court of Shorewood Unit 5
- 210 E Court of Shorewood Unit 4
- 210 E Court of Shorewood Unit 3
- 210 E Court of Shorewood Unit 2