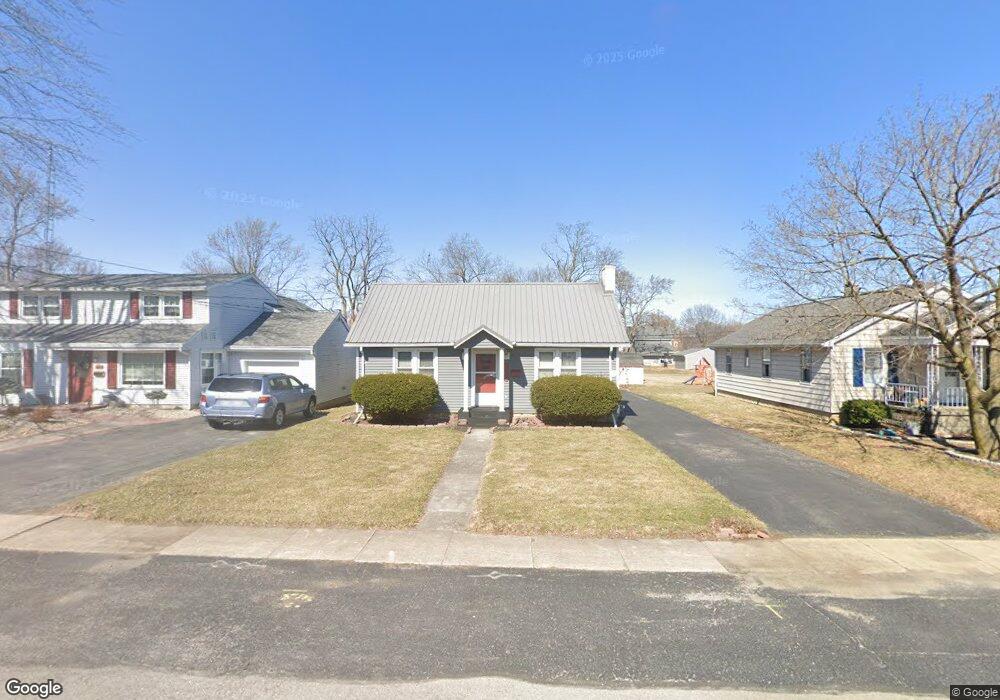
230 E Edgar Ave Findlay, OH 45840
Estimated Value: $160,382 - $206,000
2
Beds
1
Bath
1,109
Sq Ft
$165/Sq Ft
Est. Value
About This Home
This home is located at 230 E Edgar Ave, Findlay, OH 45840 and is currently estimated at $183,096, approximately $165 per square foot. 230 E Edgar Ave is a home located in Hancock County with nearby schools including Jefferson Elementary School, Chamberlin Hill Elementary School, and Donnell Middle School.
Ownership History
Date
Name
Owned For
Owner Type
Purchase Details
Closed on
Oct 3, 2008
Sold by
Mcmillen Gerald L and Mcmillen Joan P
Bought by
Bosse Kathleen S
Current Estimated Value
Home Financials for this Owner
Home Financials are based on the most recent Mortgage that was taken out on this home.
Original Mortgage
$40,000
Outstanding Balance
$26,714
Interest Rate
6.52%
Mortgage Type
Purchase Money Mortgage
Estimated Equity
$156,382
Purchase Details
Closed on
May 11, 1995
Sold by
Boroff Mary
Bought by
Mcmillen Gerald and Mcmillen Joan
Create a Home Valuation Report for This Property
The Home Valuation Report is an in-depth analysis detailing your home's value as well as a comparison with similar homes in the area
Home Values in the Area
Average Home Value in this Area
Purchase History
| Date | Buyer | Sale Price | Title Company |
|---|---|---|---|
| Bosse Kathleen S | $80,000 | Abstract Title Co | |
| Mcmillen Gerald | $22,500 | -- |
Source: Public Records
Mortgage History
| Date | Status | Borrower | Loan Amount |
|---|---|---|---|
| Open | Bosse Kathleen S | $40,000 |
Source: Public Records
Tax History
| Year | Tax Paid | Tax Assessment Tax Assessment Total Assessment is a certain percentage of the fair market value that is determined by local assessors to be the total taxable value of land and additions on the property. | Land | Improvement |
|---|---|---|---|---|
| 2024 | $1,185 | $43,170 | $5,830 | $37,340 |
| 2023 | $1,210 | $43,170 | $5,830 | $37,340 |
| 2022 | $1,220 | $43,170 | $5,830 | $37,340 |
| 2021 | $1,123 | $36,330 | $5,820 | $30,510 |
| 2020 | $1,122 | $36,330 | $5,820 | $30,510 |
| 2019 | $1,100 | $36,330 | $5,820 | $30,510 |
| 2018 | $889 | $29,150 | $4,660 | $24,490 |
| 2017 | $443 | $29,150 | $4,660 | $24,490 |
| 2016 | $885 | $29,150 | $4,660 | $24,490 |
| 2015 | $587 | $22,180 | $2,330 | $19,850 |
| 2014 | $587 | $22,180 | $2,330 | $19,850 |
| 2012 | $595 | $22,180 | $2,330 | $19,850 |
Source: Public Records
Map
Nearby Homes
- 209 E Hobart Ave
- 242 E Yates Ave
- 136 E Hobart Ave
- 400 E Pearl St
- 315 Fairlawn Place
- 3001 Goldenrod Ln
- 206 Greenlawn Ave
- 731 5th St
- 1304 Douglas Pkwy
- 123 Glendale Ave
- 1726 Eastview Dr
- 324 W Mcpherson Ave
- 2925 Goldenrod Ln
- 0 Viburnum Ct Unit 10002881
- 0 Viburnum Ct Unit 10002879
- 0 Viburnum Ct Unit 10002878
- 0 Viburnum Ct Unit 10002880
- 0 Virbunum Ct Unit 87 305267
- 10692 Cherokee Dr
- 216 1st St
- 232 E Edgar Ave
- 226 E Edgar Ave
- 234 E Edgar Ave
- 224 E Edgar Ave
- 236 E Edgar Ave
- 2110 Washington Ave
- 239 E Hobart Ave
- 2110 Washington Ave
- 233 E Hobart Ave
- 220 E Edgar Ave
- 245 E Hobart Ave
- 225 E Hobart Ave
- 231 E Edgar Ave
- 235 E Edgar Ave
- 227 E Edgar Ave
- 2100 Washington Ave
- 221 E Hobart Ave
- 237 E Edgar Ave
- 212 E Edgar Ave
- 217 E Edgar Ave
Your Personal Tour Guide
Ask me questions while you tour the home.