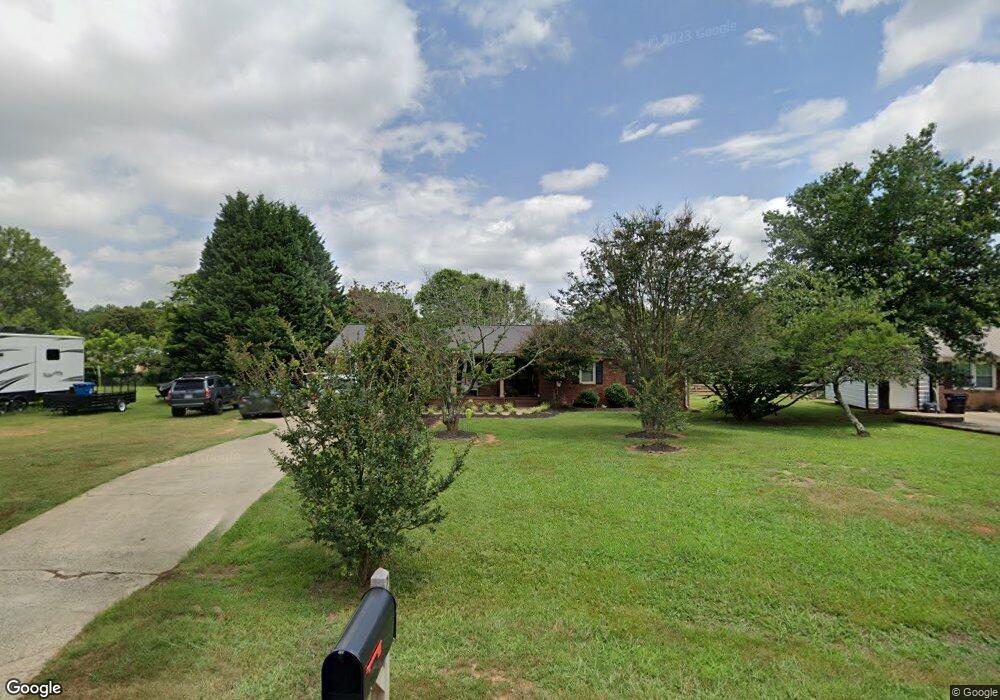
230 E Old Farm Rd Salisbury, NC 28146
Estimated Value: $252,310 - $338,000
Studio
2
Baths
1,635
Sq Ft
$183/Sq Ft
Est. Value
About This Home
This home is located at 230 E Old Farm Rd, Salisbury, NC 28146 and is currently estimated at $298,828, approximately $182 per square foot. 230 E Old Farm Rd is a home located in Rowan County with nearby schools including Elizabeth Duncan Koontz Elementary School, Southeast Middle School, and Jesse C Carson High School.
Ownership History
Date
Name
Owned For
Owner Type
Purchase Details
Closed on
Aug 31, 2022
Sold by
Shaver Angela C and Shaver Eric Larry
Bought by
Pfaff Jeremy and Pfaff Jenna
Current Estimated Value
Home Financials for this Owner
Home Financials are based on the most recent Mortgage that was taken out on this home.
Original Mortgage
$262,000
Outstanding Balance
$250,881
Interest Rate
5.54%
Mortgage Type
VA
Estimated Equity
$47,947
Purchase Details
Closed on
Dec 24, 2014
Sold by
Ashley Donald R and Wingler Angela C
Bought by
Wingler Angela C
Home Financials for this Owner
Home Financials are based on the most recent Mortgage that was taken out on this home.
Original Mortgage
$115,900
Interest Rate
4.07%
Mortgage Type
New Conventional
Create a Home Valuation Report for This Property
The Home Valuation Report is an in-depth analysis detailing your home's value as well as a comparison with similar homes in the area
Purchase History
| Date | Buyer | Sale Price | Title Company |
|---|---|---|---|
| Pfaff Jeremy | $260,000 | Mcguire Mark L | |
| Pfaff Jeremy | $260,000 | Mcguire Mark L | |
| Wingler Angela C | -- | None Available |
Source: Public Records
Mortgage History
| Date | Status | Borrower | Loan Amount |
|---|---|---|---|
| Open | Pfaff Jeremy | $262,000 | |
| Closed | Pfaff Jeremy | $262,000 | |
| Previous Owner | Wingler Angela C | $115,900 |
Source: Public Records
Tax History
| Year | Tax Paid | Tax Assessment Tax Assessment Total Assessment is a certain percentage of the fair market value that is determined by local assessors to be the total taxable value of land and additions on the property. | Land | Improvement |
|---|---|---|---|---|
| 2025 | $1,443 | $215,384 | $30,000 | $185,384 |
| 2024 | $1,443 | $215,384 | $30,000 | $185,384 |
| 2023 | $1,443 | $215,384 | $30,000 | $185,384 |
| 2022 | $891 | $119,255 | $26,500 | $92,755 |
| 2021 | $882 | $119,255 | $26,500 | $92,755 |
| 2020 | $891 | $119,255 | $26,500 | $92,755 |
| 2019 | $882 | $119,255 | $26,500 | $92,755 |
| 2018 | $775 | $105,392 | $26,500 | $78,892 |
| 2017 | $775 | $105,392 | $26,500 | $78,892 |
| 2016 | $775 | $105,392 | $26,500 | $78,892 |
| 2015 | $787 | $105,392 | $26,500 | $78,892 |
| 2014 | $775 | $108,914 | $26,500 | $82,414 |
Source: Public Records
Map
Nearby Homes
- 325 Log Barn Rd
- 535 Log Barn Rd
- 0 Bee Tree Rd
- 655 Lippard Rd
- 825 Lippard Rd
- 214 S Main St
- 823 Glover Rd
- 315 Limestone Terrace
- 285 Limestone Terrace
- 275 Limestone Terrace
- 320 Limestone Terrace
- 290 Limestone Terrace
- 280 Limestone Terrace
- Davidson Plan at Village at Granite
- Cary Plan at Village at Granite
- 270 Waterstone Dr
- 845 Saint Paul Church Rd
- 1205 Standing Oak Dr
- 0 Maple St
- 5037 Faith Rd
- 240 E Old Farm Rd
- 245 Larkspur Rd
- 250 E Old Farm Rd
- 255 Larkspur Rd
- 235 Larkspur Rd
- 235 Log Barn Rd
- 235 E Old Farm Rd
- 265 Larkspur Rd
- 260 E Old Farm Rd
- 245 E Old Farm Rd
- 335 Log Barn Rd
- 225 Log Barn Rd
- 255 E Old Farm Rd
- 275 Larkspur Rd
- 275 Larkspur Rd Unit 54 Pt 59
- 240 Log Barn Rd
- 270 E Old Farm Rd
- 345 Log Barn Rd
- 265 E Old Farm Rd
- 230 Log Barn Rd
Your Personal Tour Guide
Ask me questions while you tour the home.