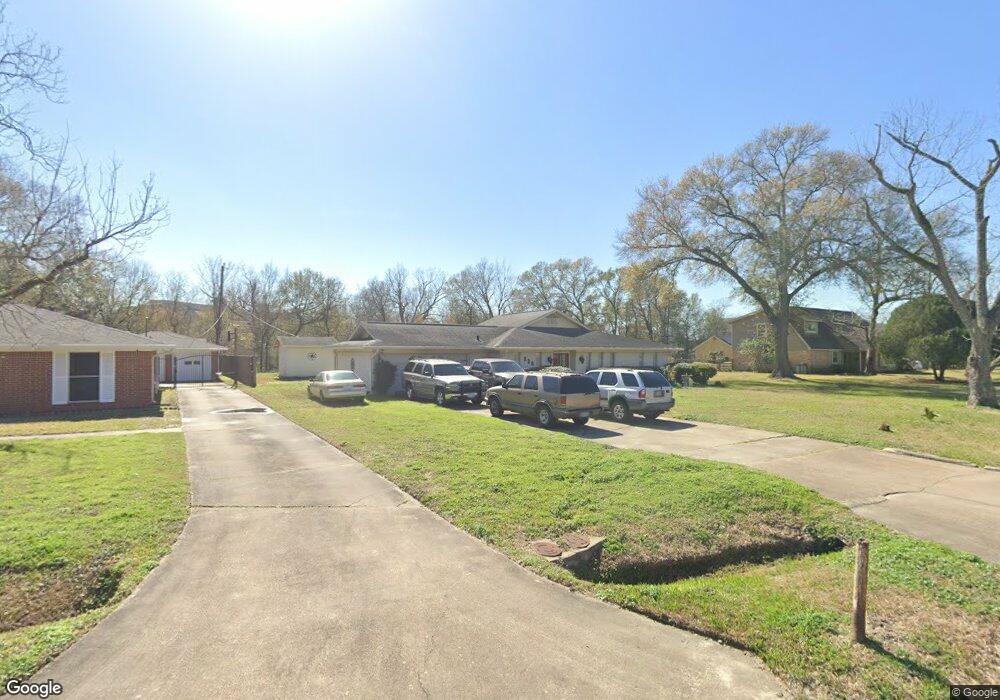
230 E Thornton Rd Houston, TX 77022
Independence Heights NeighborhoodEstimated Value: $347,875 - $429,000
4
Beds
2
Baths
2,349
Sq Ft
$171/Sq Ft
Est. Value
About This Home
This home is located at 230 E Thornton Rd, Houston, TX 77022 and is currently estimated at $401,969, approximately $171 per square foot. 230 E Thornton Rd is a home located in Harris County with nearby schools including Kennedy Elementary School, Williams Middle, and Booker T Washington Sr High.
Ownership History
Date
Name
Owned For
Owner Type
Purchase Details
Closed on
Feb 3, 2010
Sold by
Funk Chris
Bought by
Flores Nereida A
Current Estimated Value
Home Financials for this Owner
Home Financials are based on the most recent Mortgage that was taken out on this home.
Original Mortgage
$45,000
Outstanding Balance
$29,901
Interest Rate
5.11%
Mortgage Type
Stand Alone Second
Estimated Equity
$372,068
Purchase Details
Closed on
Aug 31, 2009
Sold by
Murray Herbye Elmore
Bought by
Funk Curis
Home Financials for this Owner
Home Financials are based on the most recent Mortgage that was taken out on this home.
Original Mortgage
$65,000
Interest Rate
5.16%
Mortgage Type
Purchase Money Mortgage
Purchase Details
Closed on
Jul 31, 1997
Sold by
Elmore Audria J
Bought by
Wood Stephen O
Home Financials for this Owner
Home Financials are based on the most recent Mortgage that was taken out on this home.
Original Mortgage
$60,000
Interest Rate
7.6%
Create a Home Valuation Report for This Property
The Home Valuation Report is an in-depth analysis detailing your home's value as well as a comparison with similar homes in the area
Home Values in the Area
Average Home Value in this Area
Purchase History
| Date | Buyer | Sale Price | Title Company |
|---|---|---|---|
| Flores Nereida A | -- | Startex 07 Title Company | |
| Funk Curis | -- | Startex Title | |
| Wood Stephen O | -- | Regency Title |
Source: Public Records
Mortgage History
| Date | Status | Borrower | Loan Amount |
|---|---|---|---|
| Open | Flores Nereida A | $45,000 | |
| Closed | Flores Nereida A | $56,941 | |
| Previous Owner | Funk Curis | $65,000 | |
| Previous Owner | Wood Stephen O | $60,000 |
Source: Public Records
Tax History
| Year | Tax Paid | Tax Assessment Tax Assessment Total Assessment is a certain percentage of the fair market value that is determined by local assessors to be the total taxable value of land and additions on the property. | Land | Improvement |
|---|---|---|---|---|
| 2025 | $3,653 | $290,000 | $178,950 | $111,050 |
| 2024 | $3,653 | $323,593 | $178,950 | $144,643 |
| 2023 | $3,653 | $285,628 | $143,160 | $142,468 |
| 2022 | $4,907 | $266,529 | $143,160 | $123,369 |
| 2021 | $4,721 | $244,852 | $143,160 | $101,692 |
| 2020 | $4,460 | $208,430 | $71,580 | $136,850 |
| 2019 | $4,237 | $202,535 | $71,580 | $130,955 |
| 2018 | $2,795 | $166,203 | $41,755 | $124,448 |
| 2017 | $3,499 | $166,203 | $41,755 | $124,448 |
| 2016 | $3,181 | $162,531 | $29,825 | $132,706 |
| 2015 | $1,970 | $132,553 | $29,825 | $102,728 |
| 2014 | $1,970 | $111,496 | $29,825 | $81,671 |
Source: Public Records
Map
Nearby Homes
- 4510 Trevor Park Ln
- 241 Norview Dr
- 144 Knightsbridge Park Ln
- 218 Victoria Dr
- 0 Victoria Unit 54691087
- 4516 Werner St
- 148 W Whitney St
- 126 Knightsbridge Park Ln
- 115 E Thornton Rd
- 108 Knightsbridge Park Ln
- 316 C Walthall Dr Unit D
- 316 C Walthall Dr Unit B
- 316 C Walthall Dr Unit A
- 316 C Walthall Dr Unit E
- 316 C Walthall Dr Unit F
- 316 C Walthall Dr Unit C
- 107 W Whitney St Unit E
- 121 Norview Dr
- 318 D Walthall Dr Unit D
- 318 D Walthall Dr Unit F
- 234 E Thornton Rd
- 222 E Thornton Rd
- 231 E Thornton Rd
- 227 E Thornton Rd
- 235 E Thornton Rd
- 4623 Werner St
- 4601 Werner St
- 214 E Thornton Rd
- 223 E Thornton Rd
- 4627 Werner St
- 4529 Werner St
- 4550 Lelay Cir
- 4525 Werner St
- 4554 Lelay Cir
- 219 E Thornton Rd
- 4523 Werner St
- 4546 Lelay Cir
- 258 Lena Dr
- 4555 Lelay Cir
- 254 Lena Dr
Your Personal Tour Guide
Ask me questions while you tour the home.