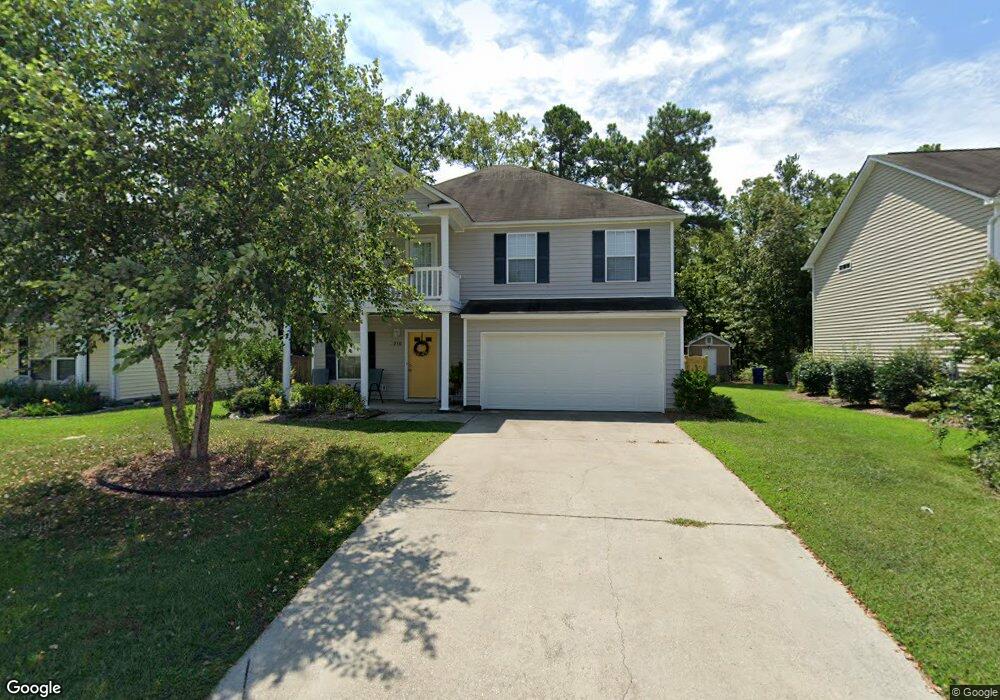
230 Eagle Pointe Dr Chapin, SC 29036
Estimated Value: $285,000 - $322,000
4
Beds
4
Baths
2,158
Sq Ft
$143/Sq Ft
Est. Value
About This Home
This home is located at 230 Eagle Pointe Dr, Chapin, SC 29036 and is currently estimated at $309,142, approximately $143 per square foot. 230 Eagle Pointe Dr is a home located in Lexington County with nearby schools including Chapin Elementary School, Chapin Intermediate, and Chapin High School.
Ownership History
Date
Name
Owned For
Owner Type
Purchase Details
Closed on
Dec 14, 2022
Sold by
Phillips Steven Michael
Bought by
Phillips Steven Michael and Phillips Courtney Brooke
Current Estimated Value
Home Financials for this Owner
Home Financials are based on the most recent Mortgage that was taken out on this home.
Original Mortgage
$288,008
Outstanding Balance
$278,431
Interest Rate
7.08%
Mortgage Type
New Conventional
Estimated Equity
$30,711
Purchase Details
Closed on
Dec 2, 2022
Sold by
Okey V Chase L
Bought by
Phillips Steven Michael
Home Financials for this Owner
Home Financials are based on the most recent Mortgage that was taken out on this home.
Original Mortgage
$288,008
Outstanding Balance
$278,431
Interest Rate
7.08%
Mortgage Type
New Conventional
Estimated Equity
$30,711
Purchase Details
Closed on
Apr 12, 2019
Sold by
Wright Mary
Bought by
Okey V Charles L
Home Financials for this Owner
Home Financials are based on the most recent Mortgage that was taken out on this home.
Original Mortgage
$5,238
Interest Rate
4.3%
Mortgage Type
Second Mortgage Made To Cover Down Payment
Purchase Details
Closed on
Apr 10, 2014
Sold by
Brubaker Mary E
Bought by
Wright Mary
Purchase Details
Closed on
May 29, 2009
Sold by
Firstar Homes Inc
Bought by
Brubaker Mary E
Home Financials for this Owner
Home Financials are based on the most recent Mortgage that was taken out on this home.
Original Mortgage
$159,120
Interest Rate
4.8%
Mortgage Type
Future Advance Clause Open End Mortgage
Create a Home Valuation Report for This Property
The Home Valuation Report is an in-depth analysis detailing your home's value as well as a comparison with similar homes in the area
Home Values in the Area
Average Home Value in this Area
Purchase History
| Date | Buyer | Sale Price | Title Company |
|---|---|---|---|
| Phillips Steven Michael | -- | South Carolina Title | |
| Phillips Steven Michael | $276,000 | South Carolina Title | |
| Okey V Charles L | $180,000 | None Available | |
| Wright Mary | -- | -- | |
| Brubaker Mary E | $156,000 | -- |
Source: Public Records
Mortgage History
| Date | Status | Borrower | Loan Amount |
|---|---|---|---|
| Open | Phillips Steven Michael | $288,008 | |
| Previous Owner | Okey V Charles L | $5,238 | |
| Previous Owner | Brubaker Mary E | $159,120 |
Source: Public Records
Tax History
| Year | Tax Paid | Tax Assessment Tax Assessment Total Assessment is a certain percentage of the fair market value that is determined by local assessors to be the total taxable value of land and additions on the property. | Land | Improvement |
|---|---|---|---|---|
| 2024 | $1,629 | $11,120 | $1,000 | $10,120 |
| 2023 | $1,701 | $7,200 | $1,000 | $6,200 |
| 2022 | $1,111 | $7,200 | $1,000 | $6,200 |
| 2020 | $1,164 | $10,800 | $1,500 | $9,300 |
| 2019 | $952 | $5,787 | $1,000 | $4,787 |
| 2018 | $838 | $5,787 | $1,000 | $4,787 |
| 2017 | $817 | $5,787 | $1,000 | $4,787 |
| 2016 | $837 | $5,787 | $1,000 | $4,787 |
| 2014 | $899 | $6,239 | $1,000 | $5,239 |
| 2013 | -- | $6,240 | $1,000 | $5,240 |
Source: Public Records
Map
Nearby Homes
- 392 Eagle Pointe Dr
- 814 Dutchmaster Dr
- 147 State Road S-32-716
- 160 State Road S-32-716
- 720 Topline St
- 1661 Old Lexington Hwy
- 153 Rushton Dr
- 1533 Saugus Ct
- 312 Throne Ct
- 366 Gallery Cliff Dr
- 368 Frick Ct
- 512 Old Bush River Rd
- 228 Bickley View Ct
- 339 Newberg Rd
- 192 Palm St
- 271 Bickley View Ct
- 627 Basalt Ct
- 358 Chapin Place Way
- 621 Basalt Ct
- 354 Chapin Place Way
- 232 Eagle Pointe Dr
- 228 Eagle Pointe Dr
- 234 Eagle Pointe Dr
- 224 Eagle Pointe Dr
- 236 Eagle Pointe Dr
- 231 Eagle Pointe Dr
- 229 Eagle Pointe Dr
- 227 Eagle Pointe Dr
- 235 Eagle Pointe Dr
- 238 Eagle Pointe Dr
- 222 Eagle Pointe Dr
- 225 Eagle Pointe Dr
- 237 Eagle Pointe Dr
- 240 Eagle Pointe Dr
- 223 Eagle Pointe Dr
- 220 Eagle Pointe Dr
- 239 Eagle Pointe Dr
- 152 Wingspan Way
- 154 Wingspan Way
- 150 Wingspan Way
Your Personal Tour Guide
Ask me questions while you tour the home.