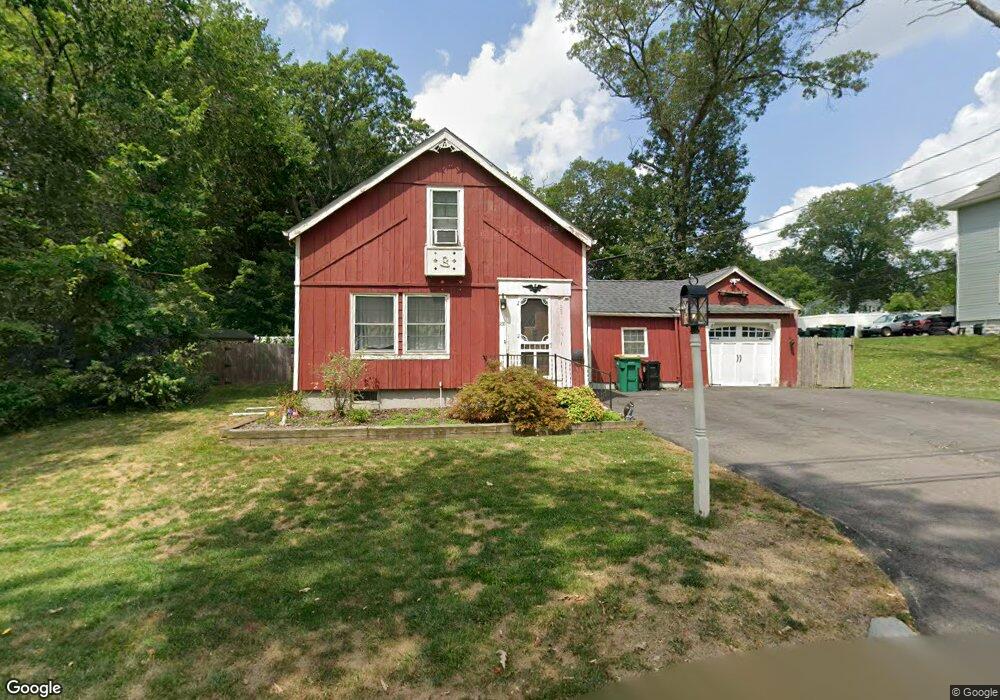
230 Fisher St North Attleboro, MA 02760
North Attleboro NeighborhoodEstimated Value: $411,000 - $479,000
2
Beds
1
Bath
893
Sq Ft
$500/Sq Ft
Est. Value
About This Home
This home is located at 230 Fisher St, North Attleboro, MA 02760 and is currently estimated at $446,108, approximately $499 per square foot. 230 Fisher St is a home located in Bristol County with nearby schools including North Attleboro High School.
Ownership History
Date
Name
Owned For
Owner Type
Purchase Details
Closed on
Mar 5, 2018
Sold by
Boffi Regina Q and Boffi Richard J
Bought by
Boffi Richard J
Current Estimated Value
Purchase Details
Closed on
Aug 31, 2001
Sold by
Philibert Fernand L and Philibert Irene M
Bought by
Boffi Richard J and Flynn Regina Q
Home Financials for this Owner
Home Financials are based on the most recent Mortgage that was taken out on this home.
Original Mortgage
$178,640
Interest Rate
7.06%
Mortgage Type
Purchase Money Mortgage
Create a Home Valuation Report for This Property
The Home Valuation Report is an in-depth analysis detailing your home's value as well as a comparison with similar homes in the area
Home Values in the Area
Average Home Value in this Area
Purchase History
| Date | Buyer | Sale Price | Title Company |
|---|---|---|---|
| Boffi Richard J | -- | -- | |
| Boffi Richard J | $181,075 | -- |
Source: Public Records
Mortgage History
| Date | Status | Borrower | Loan Amount |
|---|---|---|---|
| Previous Owner | Boffi Richard J | $178,640 | |
| Previous Owner | Boffi Richard J | $67,000 |
Source: Public Records
Tax History Compared to Growth
Tax History
| Year | Tax Paid | Tax Assessment Tax Assessment Total Assessment is a certain percentage of the fair market value that is determined by local assessors to be the total taxable value of land and additions on the property. | Land | Improvement |
|---|---|---|---|---|
| 2025 | $4,215 | $357,500 | $124,400 | $233,100 |
| 2024 | $4,015 | $347,900 | $124,400 | $223,500 |
| 2023 | $4,107 | $321,100 | $124,400 | $196,700 |
| 2022 | $3,885 | $278,900 | $124,400 | $154,500 |
| 2021 | $3,906 | $283,300 | $124,400 | $158,900 |
| 2020 | $3,951 | $275,300 | $124,400 | $150,900 |
| 2019 | $3,535 | $256,700 | $113,100 | $143,600 |
| 2018 | $3,272 | $245,300 | $113,100 | $132,200 |
| 2017 | $3,058 | $231,300 | $113,100 | $118,200 |
| 2016 | $3,157 | $238,800 | $125,700 | $113,100 |
| 2015 | $3,004 | $228,600 | $132,000 | $96,600 |
| 2014 | $2,860 | $216,000 | $122,000 | $94,000 |
Source: Public Records
Map
Nearby Homes
- 217 Fisher St
- 212 Fisher St Unit A5
- 8 Al Pace Dr Unit 8
- 3 Serengeti Dr
- 633 E Washington St Unit 17
- 633 E Washington St Unit 10
- 64 Smith St
- 0 Landry 2nd Unit 73350867
- 68 Fisher St
- 1066 Mount Hope St
- 711 Mount Hope St Unit 7
- 711 Mount Hope St Unit 6
- 711 Mount Hope St Unit 8
- 711 Mount Hope St Unit 5
- 711 Mount Hope St Unit 12
- 711 Mount Hope St Unit 9
- 711 Mount Hope St Unit 11
- 711 Mount Hope St Unit 10
- 711 Mount Hope St Unit 16
- 711 Mount Hope St Unit 15
- 242 Fisher St
- 15 Oakhurst St
- 223 Fisher St
- 237 Fisher St
- 878 Mount Hope St
- 878 Mount Hope St Unit Rear
- 90 Columbia St Unit 2
- 90 Columbia St Unit 1
- 90 Columbia St
- 90 Columbia St Unit B
- 241 Fisher St
- 80 Columbia St
- 217 Fisher St Unit 2
- 217 Fisher St Unit B
- 217 Fisher St Unit A
- 217 Fisher St Unit 1
- 12 Oakhurst St
- 12 Oakhurst St Unit 12
- 25 Oakhurst St
- 27 Oakhurst St Unit 2