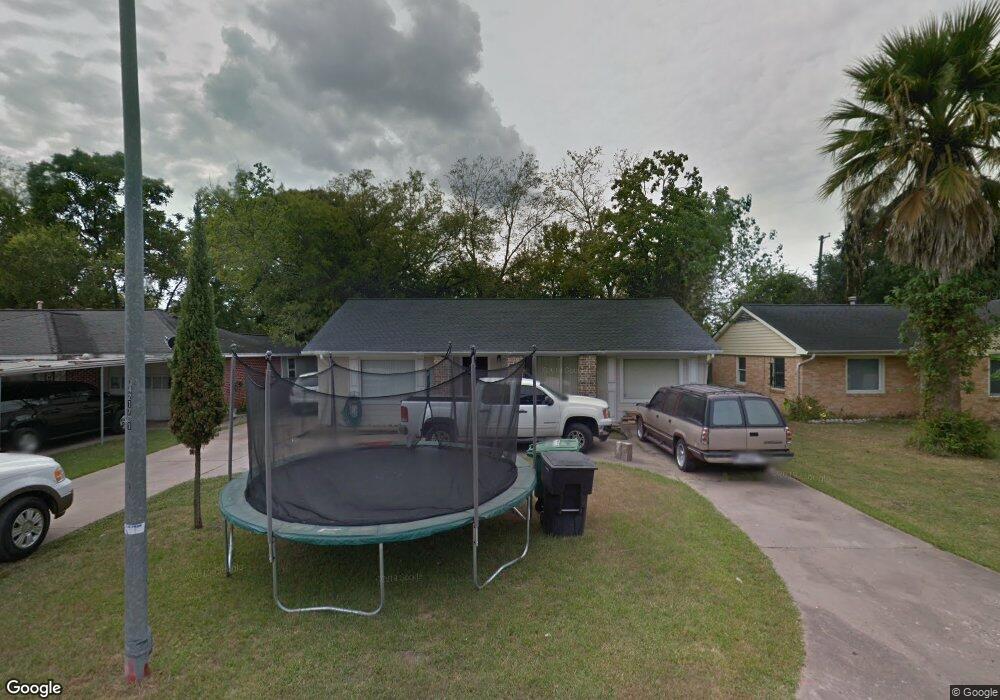
230 Floradora Ln Houston, TX 77076
Northside-Northline NeighborhoodEstimated Value: $244,638 - $291,000
3
Beds
1
Bath
1,860
Sq Ft
$142/Sq Ft
Est. Value
About This Home
This home is located at 230 Floradora Ln, Houston, TX 77076 and is currently estimated at $264,910, approximately $142 per square foot. 230 Floradora Ln is a home located in Harris County with nearby schools including Wesley Elementary School, Williams Middle, and Booker T Washington Sr High.
Ownership History
Date
Name
Owned For
Owner Type
Purchase Details
Closed on
Apr 16, 2002
Sold by
Villarreal Eusebio and Rocha Yolanda
Bought by
Botello Arturo
Current Estimated Value
Home Financials for this Owner
Home Financials are based on the most recent Mortgage that was taken out on this home.
Original Mortgage
$69,451
Outstanding Balance
$28,832
Interest Rate
6.83%
Mortgage Type
FHA
Estimated Equity
$236,078
Purchase Details
Closed on
May 7, 1998
Sold by
Delagarza Hector L and Delagarza Imelda A
Bought by
Villarreal Eusebio and Rocha Yolanda
Purchase Details
Closed on
Apr 15, 1997
Sold by
Rodriguez Ralph V
Bought by
Delagarza Hector L and Delagarza Imelda A
Purchase Details
Closed on
Mar 29, 1996
Sold by
Delagarza Benito
Bought by
Delagarza Hector L and Delagarza Imelda A
Purchase Details
Closed on
Nov 16, 1994
Sold by
Delagarza Hector and Delagarza Imelda
Bought by
Castellanos Carlos
Purchase Details
Closed on
Mar 29, 1994
Sold by
Mcgrew Murray L
Bought by
Delagarza Hector and Delagarza Imelda
Create a Home Valuation Report for This Property
The Home Valuation Report is an in-depth analysis detailing your home's value as well as a comparison with similar homes in the area
Home Values in the Area
Average Home Value in this Area
Purchase History
| Date | Buyer | Sale Price | Title Company |
|---|---|---|---|
| Botello Arturo | -- | First American Title | |
| Villarreal Eusebio | -- | -- | |
| Delagarza Hector L | -- | First American Title | |
| Delagarza Hector L | -- | -- | |
| Castellanos Carlos | -- | -- | |
| Delagarza Hector | -- | -- |
Source: Public Records
Mortgage History
| Date | Status | Borrower | Loan Amount |
|---|---|---|---|
| Open | Botello Arturo | $69,451 |
Source: Public Records
Tax History Compared to Growth
Tax History
| Year | Tax Paid | Tax Assessment Tax Assessment Total Assessment is a certain percentage of the fair market value that is determined by local assessors to be the total taxable value of land and additions on the property. | Land | Improvement |
|---|---|---|---|---|
| 2025 | $2,481 | $242,951 | $70,691 | $172,260 |
| 2024 | $2,481 | $242,951 | $70,691 | $172,260 |
| 2023 | $2,481 | $225,495 | $70,691 | $154,804 |
| 2022 | $3,635 | $172,024 | $49,484 | $122,540 |
| 2021 | $3,498 | $165,016 | $49,484 | $115,532 |
| 2020 | $3,304 | $155,547 | $49,484 | $106,063 |
| 2019 | $3,139 | $145,929 | $35,346 | $110,583 |
| 2018 | $1,992 | $112,760 | $10,604 | $102,156 |
| 2017 | $2,851 | $112,760 | $10,604 | $102,156 |
| 2016 | $2,851 | $112,760 | $10,604 | $102,156 |
| 2015 | $1,956 | $103,293 | $10,604 | $92,689 |
| 2014 | $1,956 | $103,293 | $10,604 | $92,689 |
Source: Public Records
Map
Nearby Homes
- 201 W Rosamond St Unit 41
- 201 W Rosamond St Unit 53
- 201 W Rosamond St Unit 61
- 327 Yale Oaks Ln
- 334 Yale Oaks Ln
- 410 Yale Oaks Ln
- 6057 Yale St
- 422 Yale Oaks Ln
- 427 Yale Oaks Ln
- 434 Yale Oaks Ln
- 406 Red Ripple Rd
- 302 W Hamilton St
- 304 W Hamilton Lot B St
- 304 W St
- 304 W St E
- 422 Surratt Dr
- 304 W Hamilton St
- 304 W Hamilton Lot C St
- 6100 Stuebner Airline Rd
- 522 Surratt Dr
- 234 Floradora Ln
- 226 Floradora Ln
- 238 Floradora Ln
- 230 Red Ripple Rd
- 222 Floradora Ln
- 209 Floradora Ln
- 213 Floradora Ln
- 234 Red Ripple Rd
- 237 Floradora Ln
- 218 Floradora Ln
- 238 Red Ripple Rd
- 205 Floradora Ln
- 214 Floradora Ln
- 206 Red Ripple Rd
- 210 Floradora Ln
- 242 Red Ripple Rd
- 221 Red Ripple Rd
- 225 Red Ripple Rd
- 217 Red Ripple Rd
- 229 Red Ripple Rd