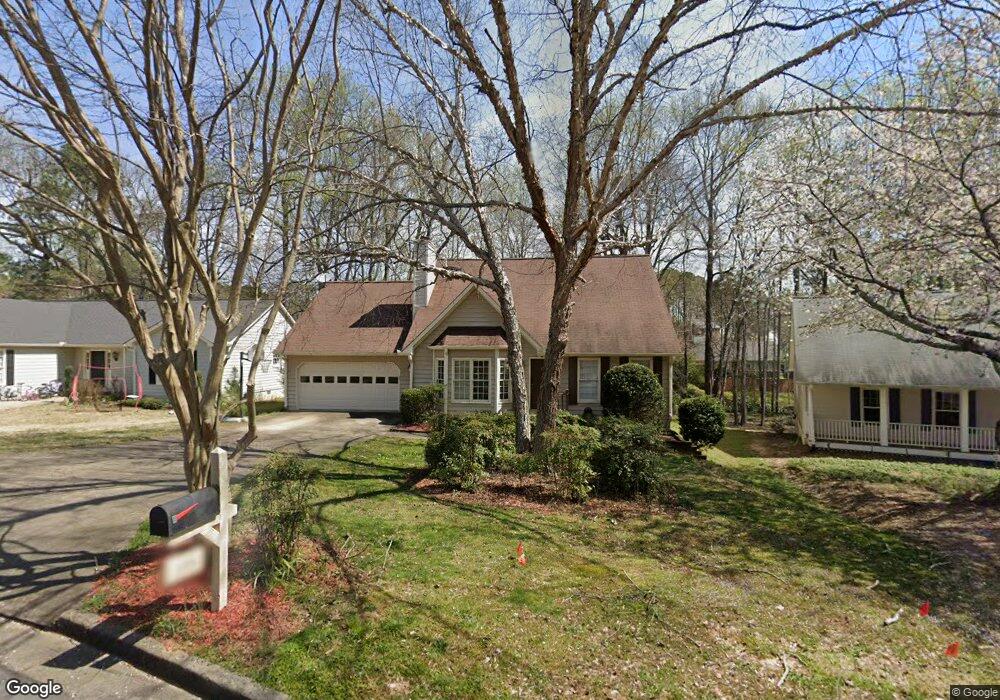
230 Frellig Trace Alpharetta, GA 30022
Estimated Value: $466,000 - $576,000
3
Beds
2
Baths
2,247
Sq Ft
$233/Sq Ft
Est. Value
About This Home
This home is located at 230 Frellig Trace, Alpharetta, GA 30022 and is currently estimated at $523,190, approximately $232 per square foot. 230 Frellig Trace is a home located in Fulton County with nearby schools including Ocee Elementary School, Taylor Road Middle School, and Chattahoochee High School.
Ownership History
Date
Name
Owned For
Owner Type
Purchase Details
Closed on
Feb 19, 2020
Sold by
Linear Investment Grp Llc
Bought by
Vsp Atlanta Llc
Current Estimated Value
Purchase Details
Closed on
Oct 16, 2009
Sold by
Mitchell Jack C
Bought by
Linear Investment Group Llc
Purchase Details
Closed on
Aug 13, 2009
Sold by
Linear Investment Group Llc
Bought by
Mitchell Jack C
Home Financials for this Owner
Home Financials are based on the most recent Mortgage that was taken out on this home.
Original Mortgage
$141,750
Interest Rate
5.15%
Mortgage Type
New Conventional
Purchase Details
Closed on
Jan 28, 2005
Sold by
Schoolcraft Michael C
Bought by
Linear Investors Grp Llc
Create a Home Valuation Report for This Property
The Home Valuation Report is an in-depth analysis detailing your home's value as well as a comparison with similar homes in the area
Home Values in the Area
Average Home Value in this Area
Purchase History
| Date | Buyer | Sale Price | Title Company |
|---|---|---|---|
| Vsp Atlanta Llc | $200,000 | -- | |
| Linear Investment Group Llc | -- | -- | |
| Mitchell Jack C | -- | -- | |
| Linear Investors Grp Llc | $152,500 | -- |
Source: Public Records
Mortgage History
| Date | Status | Borrower | Loan Amount |
|---|---|---|---|
| Previous Owner | Mitchell Jack C | $141,750 |
Source: Public Records
Tax History Compared to Growth
Tax History
| Year | Tax Paid | Tax Assessment Tax Assessment Total Assessment is a certain percentage of the fair market value that is determined by local assessors to be the total taxable value of land and additions on the property. | Land | Improvement |
|---|---|---|---|---|
| 2025 | $4,418 | $228,480 | $51,200 | $177,280 |
| 2023 | $4,155 | $147,200 | $27,680 | $119,520 |
| 2022 | $4,678 | $147,200 | $27,680 | $119,520 |
| 2021 | $3,923 | $124,520 | $27,360 | $97,160 |
| 2020 | $3,185 | $116,400 | $24,000 | $92,400 |
| 2019 | $451 | $114,400 | $23,600 | $90,800 |
| 2018 | $3,318 | $101,880 | $21,520 | $80,360 |
| 2017 | $2,683 | $78,840 | $14,680 | $64,160 |
| 2016 | $2,645 | $78,840 | $14,680 | $64,160 |
| 2015 | $2,650 | $78,120 | $14,680 | $63,440 |
| 2014 | $2,644 | $74,960 | $14,560 | $60,400 |
Source: Public Records
Map
Nearby Homes
- 11390 Ridge Hill Dr
- 4790 Roswell Mill Dr
- 310 Creekside Dr
- 690 Kimball Parc Way
- 680 Kimball Parc Way
- 130 Douglas Fir Ct Unit 1
- 4905 Weathervane Dr
- 485 Portrait Cir
- 4740 Carversham Way
- 4965 N Bridges Dr
- 134 Wards Crossing Way Unit 17
- 11686 Davenport Ln
- 11085 State Bridge Rd
- 1620 Silverleaf Way
- 11619 Davenport Ln
- 4965 Cinnabar Dr
- 5060 Cinnabar Dr
- 5022 Anclote Dr
- 1140 Park Glenn Dr
- 5160 Abbotts Bridge Rd
- 230 Frellig Trace
- 230 Frellig Trace Unit 230
- 220 Frellig Trace
- 240 Frellig Trace Unit 3
- 210 Frellig Trace
- 4785 Hampton Square Dr Unit 2
- 4775 Hampton Square Dr
- 250 Frellig Trace Unit 3
- 235 Frellig Trace
- 4795 Hampton Square Dr Unit 4
- 4765 Hampton Square Dr Unit 2
- 215 Hersfeld Ct
- 4755 Hampton Square Dr
- 225 Frellig Trace Unit 3
- 4745 Hampton Square Dr Unit 2
- 4735 Hampton Square Dr
- 260 Frellig Trace
- 245 Frellig Trace
- 255 Frellig Trace Unit 3
- 215 Frellig Trace