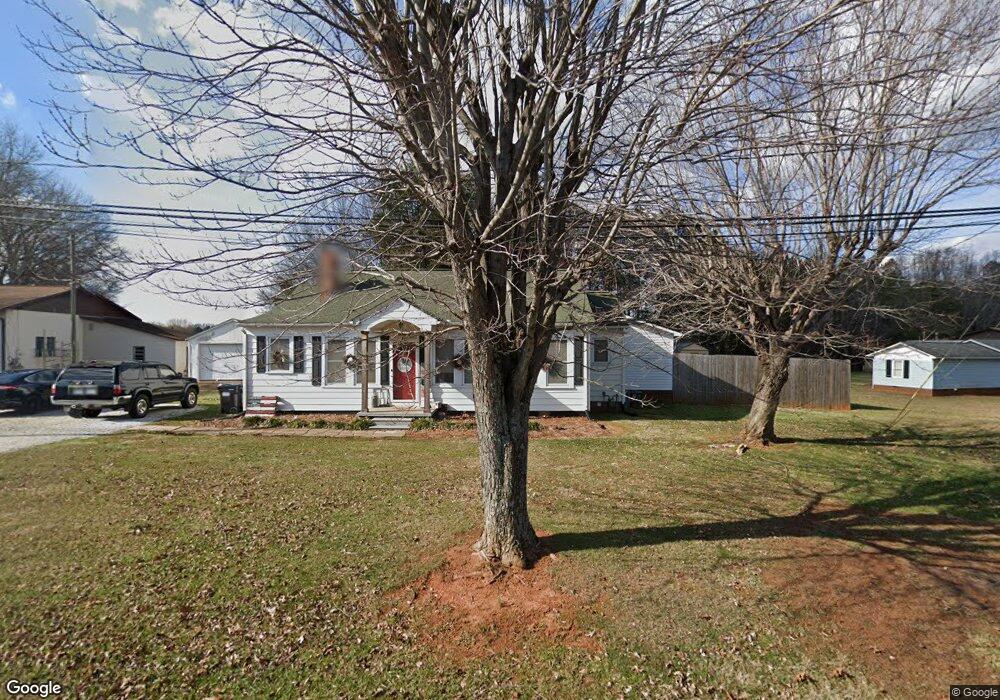
230 Gold Knob Rd Salisbury, NC 28146
Estimated Value: $154,000 - $236,000
2
Beds
1
Bath
1,200
Sq Ft
$175/Sq Ft
Est. Value
About This Home
This home is located at 230 Gold Knob Rd, Salisbury, NC 28146 and is currently estimated at $209,534, approximately $174 per square foot. 230 Gold Knob Rd is a home located in Rowan County with nearby schools including Rockwell Elementary School, Charles C Erwin Middle School, and East Rowan High School.
Ownership History
Date
Name
Owned For
Owner Type
Purchase Details
Closed on
May 18, 2010
Sold by
Deutsche Bank National Trust Company
Bought by
Ridenhour H Richard
Current Estimated Value
Purchase Details
Closed on
Nov 10, 2009
Sold by
Elmore Sherry
Bought by
Deutsche Bank National Trust Company
Purchase Details
Closed on
Feb 20, 2006
Sold by
Bunton Matthew B
Bought by
Elmore Sherry
Home Financials for this Owner
Home Financials are based on the most recent Mortgage that was taken out on this home.
Original Mortgage
$70,000
Interest Rate
8.12%
Mortgage Type
Fannie Mae Freddie Mac
Purchase Details
Closed on
Dec 27, 2005
Sold by
Bunton Matthew B
Bought by
Elmore Sherry
Home Financials for this Owner
Home Financials are based on the most recent Mortgage that was taken out on this home.
Original Mortgage
$70,000
Interest Rate
8.12%
Mortgage Type
Fannie Mae Freddie Mac
Create a Home Valuation Report for This Property
The Home Valuation Report is an in-depth analysis detailing your home's value as well as a comparison with similar homes in the area
Home Values in the Area
Average Home Value in this Area
Purchase History
| Date | Buyer | Sale Price | Title Company |
|---|---|---|---|
| Ridenhour H Richard | $40,000 | None Available | |
| Deutsche Bank National Trust Company | $57,750 | None Available | |
| Elmore Sherry | -- | None Available | |
| Elmore Sherry | $87,500 | None Available |
Source: Public Records
Mortgage History
| Date | Status | Borrower | Loan Amount |
|---|---|---|---|
| Previous Owner | Elmore Sherry | $70,000 | |
| Previous Owner | Elmore Sherry | $17,500 |
Source: Public Records
Tax History Compared to Growth
Tax History
| Year | Tax Paid | Tax Assessment Tax Assessment Total Assessment is a certain percentage of the fair market value that is determined by local assessors to be the total taxable value of land and additions on the property. | Land | Improvement |
|---|---|---|---|---|
| 2025 | $1,128 | $168,379 | $25,725 | $142,654 |
| 2024 | $1,128 | $168,379 | $25,725 | $142,654 |
| 2023 | $1,128 | $168,379 | $25,725 | $142,654 |
| 2022 | $572 | $76,512 | $18,743 | $57,769 |
| 2021 | $572 | $76,512 | $18,743 | $57,769 |
| 2020 | $572 | $76,512 | $18,743 | $57,769 |
| 2019 | $572 | $76,512 | $18,743 | $57,769 |
| 2018 | $484 | $65,328 | $18,742 | $46,586 |
| 2017 | $484 | $65,328 | $18,742 | $46,586 |
| 2016 | $484 | $65,328 | $18,742 | $46,586 |
| 2015 | $492 | $65,328 | $18,742 | $46,586 |
| 2014 | $489 | $67,856 | $18,742 | $49,114 |
Source: Public Records
Map
Nearby Homes
- 660 Sides Rd
- 1090 Sides St
- 574 Crescent Rd
- 495 Gold Knob Rd
- 170 Lyerly Dr
- 1044 Oak Grove Ln Unit Lot 2
- 0000 Celestial Dr
- 455 Stone Rd
- 175 Birchwood Dr Unit 7
- 165 Birchwood Dr Unit 17
- 7660 Pop Basinger Rd
- 145 Willow Dr
- 130 Delinda Dr
- 1170 Gold Knob Rd
- 0 Cornelius Rd
- 311 Palmer Cir
- 1106 Birch St
- 1450 Saint Lukes Church Rd
- 316 Hutchins Way
- 11165 U S Route 52
- 220 Gold Knob Rd
- 190 Gold Knob Rd
- 280 Gold Knob Rd
- 245 Gold Knob Rd
- 285 Gold Knob Rd
- 195 Gold Knob Rd
- 175 Gold Knob Rd
- 165 Gold Knob Rd
- 7735 Us Highway 52
- 7765 Us Highway 52
- 115 Sunset St
- 7785 Us Highway 52
- 135 Gold Knob Rd
- 1009 Sides St
- 7835 Us Highway 52
- 1005 Sides St
- 580 Sides Rd
- 107 Anthony Rd
- 105 Anthony Rd
- 7740 Hwy 52 Hwy