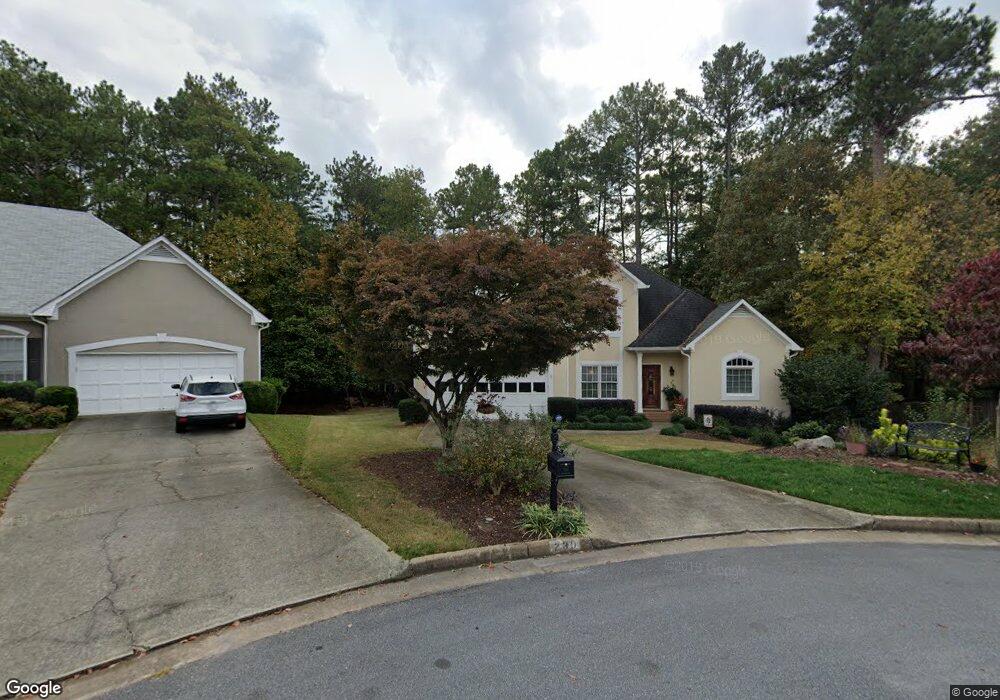
230 Ivey Oaks Way Roswell, GA 30076
Newtown NeighborhoodEstimated Value: $591,000 - $636,000
3
Beds
3
Baths
2,279
Sq Ft
$268/Sq Ft
Est. Value
About This Home
This home is located at 230 Ivey Oaks Way, Roswell, GA 30076 and is currently estimated at $609,742, approximately $267 per square foot. 230 Ivey Oaks Way is a home located in Fulton County with nearby schools including Northwood Elementary School, Haynes Bridge Middle School, and Centennial High School.
Ownership History
Date
Name
Owned For
Owner Type
Purchase Details
Closed on
Jun 16, 1999
Sold by
Burgett Suzanne E
Bought by
Zebrak Nancy C
Current Estimated Value
Home Financials for this Owner
Home Financials are based on the most recent Mortgage that was taken out on this home.
Original Mortgage
$128,100
Outstanding Balance
$34,007
Interest Rate
7.13%
Mortgage Type
New Conventional
Estimated Equity
$575,735
Purchase Details
Closed on
Aug 30, 1994
Sold by
Messick Frances T
Bought by
Glickman Mark A Suzanne
Home Financials for this Owner
Home Financials are based on the most recent Mortgage that was taken out on this home.
Original Mortgage
$150,950
Interest Rate
7.62%
Purchase Details
Closed on
Mar 11, 1994
Sold by
Brumby Props Inc
Bought by
Messick Frances J
Home Financials for this Owner
Home Financials are based on the most recent Mortgage that was taken out on this home.
Original Mortgage
$139,650
Interest Rate
7.61%
Create a Home Valuation Report for This Property
The Home Valuation Report is an in-depth analysis detailing your home's value as well as a comparison with similar homes in the area
Home Values in the Area
Average Home Value in this Area
Purchase History
| Date | Buyer | Sale Price | Title Company |
|---|---|---|---|
| Zebrak Nancy C | $183,000 | -- | |
| Glickman Mark A Suzanne | $158,900 | -- | |
| Messick Frances J | $155,500 | -- |
Source: Public Records
Mortgage History
| Date | Status | Borrower | Loan Amount |
|---|---|---|---|
| Open | Zebrak Nancy C | $128,100 | |
| Previous Owner | Glickman Mark A Suzanne | $150,950 | |
| Previous Owner | Messick Frances J | $139,650 |
Source: Public Records
Tax History Compared to Growth
Tax History
| Year | Tax Paid | Tax Assessment Tax Assessment Total Assessment is a certain percentage of the fair market value that is determined by local assessors to be the total taxable value of land and additions on the property. | Land | Improvement |
|---|---|---|---|---|
| 2025 | $1,387 | $202,080 | $47,160 | $154,920 |
| 2023 | $5,719 | $202,600 | $48,360 | $154,240 |
| 2022 | $1,279 | $162,600 | $34,240 | $128,360 |
| 2021 | $1,238 | $157,880 | $33,240 | $124,640 |
| 2020 | $1,227 | $151,360 | $31,320 | $120,040 |
| 2019 | $60 | $152,920 | $30,160 | $122,760 |
| 2018 | $1,520 | $135,600 | $29,520 | $106,080 |
| 2017 | $1,142 | $112,560 | $24,320 | $88,240 |
| 2016 | $1,082 | $112,560 | $24,320 | $88,240 |
| 2015 | $1,083 | $112,560 | $24,320 | $88,240 |
| 2014 | $813 | $97,960 | $15,600 | $82,360 |
Source: Public Records
Map
Nearby Homes
- 440 Guildhall Grove Unit 2
- 710 Leeds Garden Terrace
- 3040 Roxburgh Dr
- 140 Old Sandhurst Landing
- 3077 Haynes Trail
- 2642 Long Pointe
- 10085 Old Woodland Entry
- 385 Birch Rill Dr
- 130 Forrest View Terrace
- 305 Birch Rill Dr
- 1020 Summer Oaks Close Unit 4
- 10421 Park Walk Point
- 280 Vidaulan Ct
- 10280 Crescent Ridge Dr
- 225 Wentworth Terrace
- 300 Olmstead Way
- 220 Ivey Oaks Way
- 225 Ivey Oaks Way
- 210 Ivey Oaks Way
- 200 Ivey Oaks Way
- 215 Ivey Oaks Way
- 2990 Ivey Oaks Ln
- 2960 Ivey Oaks Ln
- 2950 Ivey Oaks Ln
- 520 Ivey Pointe Way
- 3000 Ivey Oaks Ln
- 0 Ivey Oaks Ln
- 510 Ivey Pointe Way
- 530 Ivey Pointe Way
- 2940 Ivey Oaks Ln
- 2950 Ivey Ridge Ln
- 500 Ivey Pointe Way
- 2985 Ivey Oaks Ln
- 2975 Ivey Oaks Ln
- 2930 Ivey Oaks Ln
- 535 Ivey Pointe Way