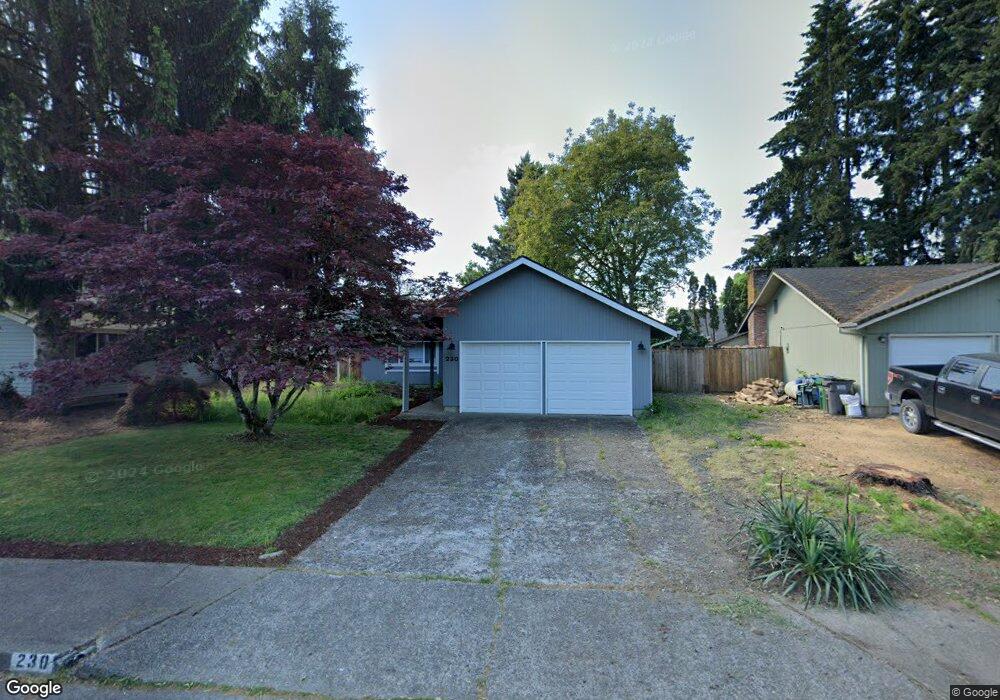
230 Lynnbrook Dr Eugene, OR 97404
Santa Clara NeighborhoodEstimated Value: $370,678 - $400,000
3
Beds
2
Baths
992
Sq Ft
$382/Sq Ft
Est. Value
About This Home
This home is located at 230 Lynnbrook Dr, Eugene, OR 97404 and is currently estimated at $378,920, approximately $381 per square foot. 230 Lynnbrook Dr is a home located in Lane County with nearby schools including Spring Creek Elementary School, Madison Middle School, and North Eugene High School.
Ownership History
Date
Name
Owned For
Owner Type
Purchase Details
Closed on
Mar 17, 2010
Sold by
Apker Richard G and Apker Courtney L
Bought by
Apker Richard G and Apker Courtney L
Current Estimated Value
Home Financials for this Owner
Home Financials are based on the most recent Mortgage that was taken out on this home.
Original Mortgage
$138,000
Outstanding Balance
$91,196
Interest Rate
5%
Mortgage Type
New Conventional
Estimated Equity
$287,724
Purchase Details
Closed on
Dec 13, 2002
Sold by
Household Finance Corp Ii
Bought by
Apker Richard G and Pierce Courtney L
Home Financials for this Owner
Home Financials are based on the most recent Mortgage that was taken out on this home.
Original Mortgage
$120,582
Interest Rate
6.03%
Mortgage Type
FHA
Purchase Details
Closed on
Sep 3, 2002
Sold by
Nanooruk Frank S and Nanooruk Pamela K
Bought by
Household Finance Corp Ii
Create a Home Valuation Report for This Property
The Home Valuation Report is an in-depth analysis detailing your home's value as well as a comparison with similar homes in the area
Home Values in the Area
Average Home Value in this Area
Purchase History
| Date | Buyer | Sale Price | Title Company |
|---|---|---|---|
| Apker Richard G | -- | Evergreen Land Title Company | |
| Apker Richard G | $122,500 | Evergreen Land Title Co | |
| Household Finance Corp Ii | -- | Western Pioneer Title Co |
Source: Public Records
Mortgage History
| Date | Status | Borrower | Loan Amount |
|---|---|---|---|
| Open | Apker Richard G | $138,000 | |
| Closed | Apker Richard G | $120,582 |
Source: Public Records
Tax History
| Year | Tax Paid | Tax Assessment Tax Assessment Total Assessment is a certain percentage of the fair market value that is determined by local assessors to be the total taxable value of land and additions on the property. | Land | Improvement |
|---|---|---|---|---|
| 2025 | $2,823 | $202,411 | -- | -- |
| 2024 | $2,803 | $196,516 | -- | -- |
| 2023 | $2,803 | $190,793 | $0 | $0 |
| 2022 | $2,635 | $185,236 | $0 | $0 |
| 2021 | $2,372 | $179,841 | $0 | $0 |
| 2020 | $2,403 | $174,603 | $0 | $0 |
| 2019 | $2,299 | $169,518 | $0 | $0 |
| 2018 | $2,095 | $159,787 | $0 | $0 |
| 2017 | $1,921 | $159,787 | $0 | $0 |
| 2016 | $1,812 | $155,133 | $0 | $0 |
| 2015 | $1,748 | $150,615 | $0 | $0 |
| 2014 | $1,704 | $146,228 | $0 | $0 |
Source: Public Records
Map
Nearby Homes
- 709 Tyson Ln
- 212 Chimney Rock Ln
- 3985 Shenstone Dr
- 591 Argon Ave
- 420 Lynnbrook Dr
- 4278 Torrington Ave
- 3698 Revell St
- 4393 Altura St
- 1133 Irvington Dr
- 4115 Berrywood Dr
- 579 Sweetwater Ln
- 4490 Doyle St
- 47 van Fossen Ct
- 4366 Berry Ln
- 374 Blackfoot Ave
- 110 Calumet Ave
- 3256 Marvin Dr
- 4471 Spring Meadow Ave
- 3365 Goose Cross Ln
- 329 Dean Ave
- 240 Lynnbrook Dr
- 220 Lynnbrook Dr
- 549 Naismith Blvd
- 555 Naismith Blvd
- 543 Naismith Blvd
- 250 Lynnbrook Dr
- 210 Lynnbrook Dr
- 198 Lynnbrook Dr
- 563 Naismith Blvd
- 537 Naismith Blvd
- 4005 Meredith Ct
- 225 Lynnbrook Dr
- 260 Lynnbrook Dr
- 571 Naismith Blvd
- 531 Naismith Blvd
- 4004 Wakefield Ct
- 194 Lynnbrook Dr
- 4004 Meredith Ct
- 270 Lynnbrook Dr
- 4015 Meredith Ct
Your Personal Tour Guide
Ask me questions while you tour the home.