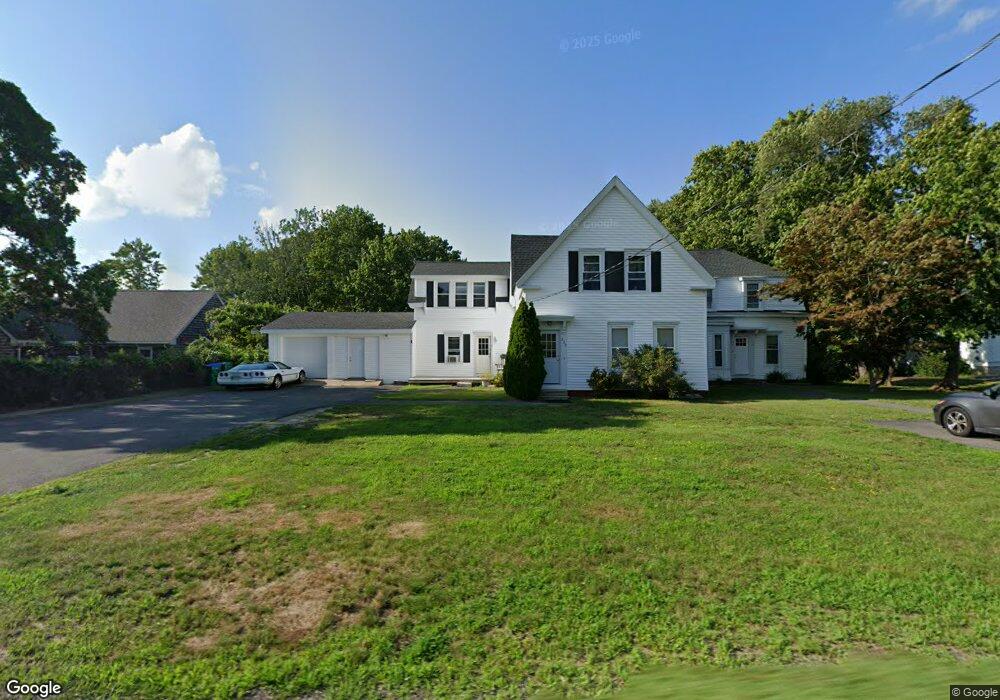
230 Main St Hanson, MA 02341
Estimated Value: $641,000 - $848,000
5
Beds
3
Baths
2,833
Sq Ft
$266/Sq Ft
Est. Value
About This Home
This home is located at 230 Main St, Hanson, MA 02341 and is currently estimated at $753,133, approximately $265 per square foot. 230 Main St is a home located in Plymouth County.
Ownership History
Date
Name
Owned For
Owner Type
Purchase Details
Closed on
Sep 13, 2021
Sold by
230 Main St Hanson Llc
Bought by
Clarke Robert A
Current Estimated Value
Home Financials for this Owner
Home Financials are based on the most recent Mortgage that was taken out on this home.
Original Mortgage
$469,000
Outstanding Balance
$426,755
Interest Rate
2.8%
Mortgage Type
Stand Alone Refi Refinance Of Original Loan
Estimated Equity
$326,378
Purchase Details
Closed on
Oct 15, 2020
Sold by
Clarke Robert A
Bought by
230 Main St Hanson Llc
Purchase Details
Closed on
May 15, 2007
Sold by
Alden John L and Alden Janice M
Bought by
Clarke Robert A
Home Financials for this Owner
Home Financials are based on the most recent Mortgage that was taken out on this home.
Original Mortgage
$291,920
Interest Rate
6.21%
Mortgage Type
Purchase Money Mortgage
Create a Home Valuation Report for This Property
The Home Valuation Report is an in-depth analysis detailing your home's value as well as a comparison with similar homes in the area
Home Values in the Area
Average Home Value in this Area
Purchase History
| Date | Buyer | Sale Price | Title Company |
|---|---|---|---|
| Clarke Robert A | -- | None Available | |
| Clarke Robert A | -- | None Available | |
| 230 Main St Hanson Llc | -- | None Available | |
| 230 Main St Hanson Llc | -- | None Available | |
| Clarke Robert A | $364,900 | -- | |
| Clarke Robert A | $364,900 | -- |
Source: Public Records
Mortgage History
| Date | Status | Borrower | Loan Amount |
|---|---|---|---|
| Open | Clarke Robert A | $469,000 | |
| Previous Owner | Clarke Robert A | $291,920 |
Source: Public Records
Tax History Compared to Growth
Tax History
| Year | Tax Paid | Tax Assessment Tax Assessment Total Assessment is a certain percentage of the fair market value that is determined by local assessors to be the total taxable value of land and additions on the property. | Land | Improvement |
|---|---|---|---|---|
| 2025 | $8,102 | $605,500 | $214,800 | $390,700 |
| 2024 | $7,869 | $588,100 | $208,600 | $379,500 |
| 2023 | $7,895 | $556,800 | $226,400 | $330,400 |
| 2022 | $7,545 | $500,000 | $205,800 | $294,200 |
| 2021 | $5,090 | $455,600 | $197,900 | $257,700 |
| 2020 | $4,598 | $419,700 | $191,200 | $228,500 |
| 2019 | $6,144 | $395,600 | $187,600 | $208,000 |
| 2018 | $5,911 | $373,400 | $173,300 | $200,100 |
| 2017 | $5,114 | $320,000 | $165,000 | $155,000 |
| 2016 | $4,902 | $296,200 | $165,000 | $131,200 |
| 2015 | $4,680 | $294,000 | $165,000 | $129,000 |
Source: Public Records
Map
Nearby Homes
- 230 Main St Unit 2
- 230 Main St Unit 3
- 240 Main St
- 239 Main St
- 217 Main St
- 251 Main St
- 209 Main St
- 240 Maquon St
- 263 Main St
- 263 Main St Unit C
- 270 Main St Unit A-2
- 270 Main St Unit A4
- 270 Main St Unit 10-13
- 270 Main St Unit B3
- 270 Main St Unit B4
- 270 Main St Unit B6
- 270 Main St Unit A2-3
- 270 Main St Unit A-3
- 195 Main St
- 184 Main St