Estimated Value: $102,000 - $146,000
2
Beds
1
Bath
2,826
Sq Ft
$42/Sq Ft
Est. Value
About This Home
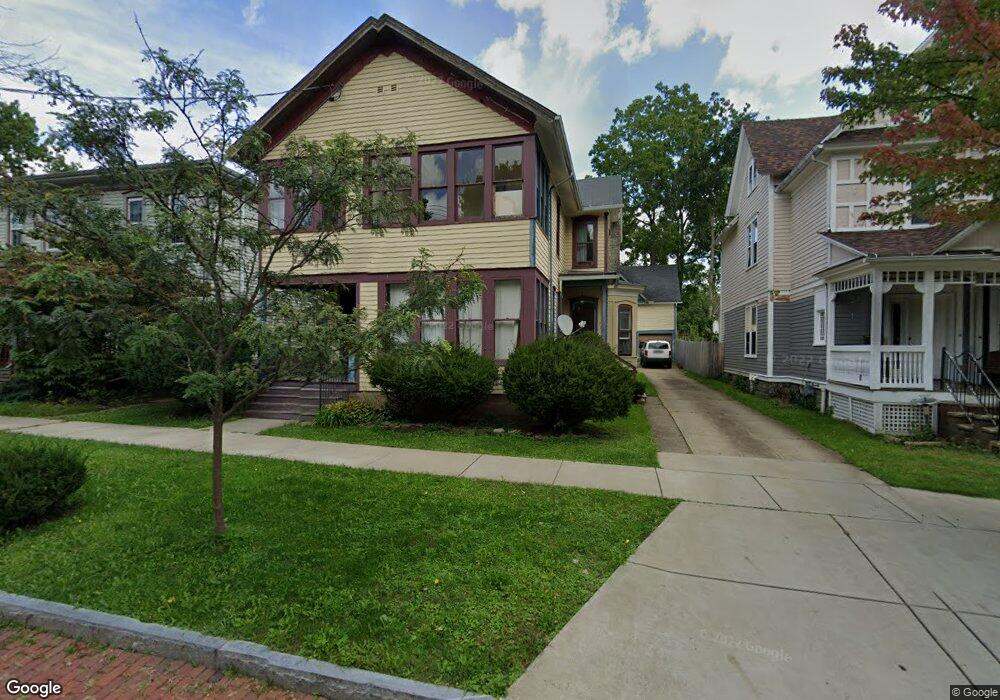
This home is located at 230 N 3rd St, Olean, NY 14760 and is currently estimated at $117,912, approximately $41 per square foot. 230 N 3rd St is a home located in Cattaraugus County with nearby schools including Olean Intermediate-Middle School, Olean Senior High School, and Southern Tier Catholic School.
Ownership History
Date
Name
Owned For
Owner Type
Purchase Details
Closed on
Sep 4, 2014
Sold by
Hamlin Bank And Trust Company
Bought by
Middaugh Richard
Current Estimated Value
Purchase Details
Closed on
Mar 3, 2014
Sold by
Gilds Christopher D
Bought by
Hamlin Bank And Trust Co
Purchase Details
Closed on
Apr 2, 2010
Sold by
Harvison Carl
Bought by
Gilds Christopher
Purchase Details
Closed on
Feb 7, 2003
Sold by
Scott Clifton E
Bought by
Harvison Carl E
Create a Home Valuation Report for This Property
The Home Valuation Report is an in-depth analysis detailing your home's value as well as a comparison with similar homes in the area
Home Values in the Area
Average Home Value in this Area
Purchase History
| Date | Buyer | Sale Price | Title Company |
|---|---|---|---|
| Middaugh Richard | $20,000 | Kathleen Moriarty | |
| Hamlin Bank And Trust Co | -- | Daniel J. Hartle | |
| Gilds Christopher | $53,800 | J. Michael Shane | |
| Harvison Carl E | $75,000 | Daniel R. Palumbo |
Source: Public Records
Tax History
| Year | Tax Paid | Tax Assessment Tax Assessment Total Assessment is a certain percentage of the fair market value that is determined by local assessors to be the total taxable value of land and additions on the property. | Land | Improvement |
|---|---|---|---|---|
| 2025 | $3,402 | $53,800 | $4,100 | $49,700 |
| 2024 | $3,402 | $53,800 | $4,100 | $49,700 |
| 2023 | $2,025 | $53,800 | $4,100 | $49,700 |
| 2022 | $2,055 | $53,800 | $4,100 | $49,700 |
| 2021 | $2,114 | $53,800 | $4,100 | $49,700 |
| 2020 | $2,129 | $53,800 | $4,100 | $49,700 |
| 2019 | $1,884 | $53,800 | $4,100 | $49,700 |
| 2018 | $4,176 | $53,800 | $4,100 | $49,700 |
| 2017 | $4,606 | $53,800 | $4,100 | $49,700 |
| 2016 | $4,562 | $53,800 | $4,100 | $49,700 |
| 2015 | -- | $53,800 | $4,100 | $49,700 |
| 2014 | -- | $53,800 | $4,100 | $49,700 |
Source: Public Records
Map
Nearby Homes
Your Personal Tour Guide
Ask me questions while you tour the home.