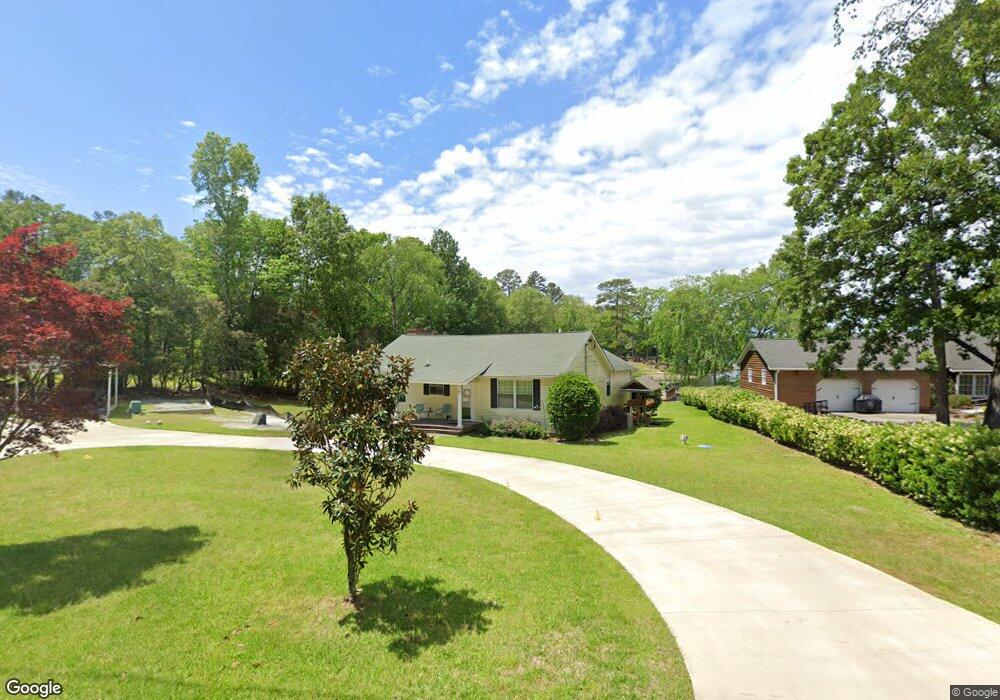
230 Old Forge Rd Chapin, SC 29036
Estimated Value: $572,462 - $687,000
3
Beds
2
Baths
1,380
Sq Ft
$460/Sq Ft
Est. Value
About This Home
This home is located at 230 Old Forge Rd, Chapin, SC 29036 and is currently estimated at $634,866, approximately $460 per square foot. 230 Old Forge Rd is a home located in Lexington County with nearby schools including Lake Murray Elementary School, Chapin Intermediate, and Chapin High School.
Ownership History
Date
Name
Owned For
Owner Type
Purchase Details
Closed on
Oct 15, 2016
Sold by
Coln Barry K and Coln Rebecca F
Bought by
Jerdan Stephen M and Jerdan Tara W
Current Estimated Value
Home Financials for this Owner
Home Financials are based on the most recent Mortgage that was taken out on this home.
Original Mortgage
$305,600
Outstanding Balance
$244,649
Interest Rate
3.5%
Mortgage Type
New Conventional
Estimated Equity
$390,217
Purchase Details
Closed on
Nov 30, 2005
Sold by
Sandifer Brooks R
Bought by
Coln Barry K and Coln Rebecca F
Home Financials for this Owner
Home Financials are based on the most recent Mortgage that was taken out on this home.
Original Mortgage
$260,000
Interest Rate
6.62%
Mortgage Type
Adjustable Rate Mortgage/ARM
Purchase Details
Closed on
Aug 11, 2003
Sold by
Huffman Ron P
Bought by
Otoole Susan Chaplin
Purchase Details
Closed on
Jul 31, 2003
Sold by
Robinson Joel O
Bought by
Sandifer Brooks R
Create a Home Valuation Report for This Property
The Home Valuation Report is an in-depth analysis detailing your home's value as well as a comparison with similar homes in the area
Home Values in the Area
Average Home Value in this Area
Purchase History
| Date | Buyer | Sale Price | Title Company |
|---|---|---|---|
| Jerdan Stephen M | $321,700 | None Available | |
| Coln Barry K | $325,000 | -- | |
| Otoole Susan Chaplin | -- | -- | |
| Sandifer Brooks R | $140,000 | -- |
Source: Public Records
Mortgage History
| Date | Status | Borrower | Loan Amount |
|---|---|---|---|
| Open | Jerdan Stephen M | $305,600 | |
| Previous Owner | Coln Barry K | $260,000 |
Source: Public Records
Tax History
| Year | Tax Paid | Tax Assessment Tax Assessment Total Assessment is a certain percentage of the fair market value that is determined by local assessors to be the total taxable value of land and additions on the property. | Land | Improvement |
|---|---|---|---|---|
| 2024 | $2,302 | $13,975 | $9,000 | $4,975 |
| 2023 | $2,139 | $13,975 | $9,000 | $4,975 |
| 2022 | $2,158 | $13,975 | $9,000 | $4,975 |
| 2020 | $2,260 | $13,975 | $9,000 | $4,975 |
| 2019 | $2,117 | $12,868 | $5,824 | $7,044 |
| 2018 | $1,863 | $12,868 | $5,824 | $7,044 |
| 2017 | $1,815 | $12,868 | $5,824 | $7,044 |
| 2016 | $6,570 | $16,143 | $8,736 | $7,407 |
| 2014 | $6,537 | $16,760 | $8,995 | $7,765 |
| 2013 | -- | $16,760 | $9,000 | $7,760 |
Source: Public Records
Map
Nearby Homes
- 435 Whits End
- 345 Rising Stream Way
- 343 Rising Stream Way
- 407 Rising Stream Way
- 337 Rising Stream Way
- 415 Rising Stream Way
- 403 Rising Stream Way
- 414 Rising Stream Way
- 419 Rising Stream Way
- 427 Rising Stream Way
- 314 Rising Stream Way
- 311 Rising Stream Way
- 306 Rising Stream Way
- 24 Beards Creek Cir
- 302 Rising Stream Way
- 533 Mitscher Way
- 516 Mitscher Way
- 734 Autumn Shiloh Dr
- 932 Trident Maple Ln
- 940 Willow Cove Rd
- 226 Old Forge Rd
- 234 Old Forge Rd
- 225 Old Forge Rd
- 0 Hair Point
- 321 Hair Point
- 216 Old Forge Rd
- 329 Hair Point
- 240 Old Forge Rd
- 337 Hair Point
- 315 Hair Point
- 225 Ralphs Rd
- 207 Old Forge Rd
- 311 Hair Point
- 345 Hair Point
- 246 Old Forge Rd
- 209 Old Forge Rd
- 354 Hair Point
- 351 Hair Point
- 353 Hair Point
- 205 Old Forge Rd
Your Personal Tour Guide
Ask me questions while you tour the home.