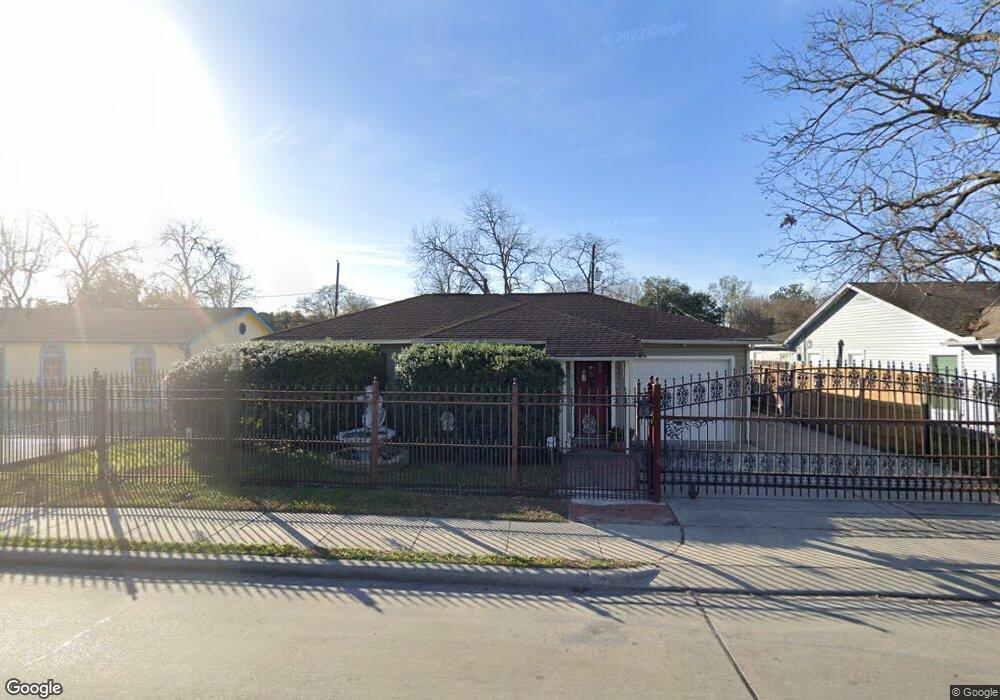
230 Parker Rd Houston, TX 77076
Northside-Northline NeighborhoodEstimated Value: $178,000 - $224,000
2
Beds
2
Baths
1,600
Sq Ft
$129/Sq Ft
Est. Value
About This Home
This home is located at 230 Parker Rd, Houston, TX 77076 and is currently estimated at $205,984, approximately $128 per square foot. 230 Parker Rd is a home located in Harris County with nearby schools including DeChaumes Elementary School, Fonville Middle School, and Sam Houston Math, Science & Technology Center.
Ownership History
Date
Name
Owned For
Owner Type
Purchase Details
Closed on
Aug 20, 2018
Sold by
Ngheim Phong and Pram Dianna
Bought by
Agua Buena Llc
Current Estimated Value
Purchase Details
Closed on
Jul 28, 2016
Sold by
Nguyen Binh Cong
Bought by
Hang Xiao
Purchase Details
Closed on
Jun 30, 2015
Sold by
Flores Homes Builders Llc
Bought by
Ngheim Phong
Home Financials for this Owner
Home Financials are based on the most recent Mortgage that was taken out on this home.
Original Mortgage
$145,600
Interest Rate
3.9%
Mortgage Type
New Conventional
Purchase Details
Closed on
Dec 3, 2013
Sold by
Mariaca Luis Antonio and Mariaca Ana Luisa
Bought by
Molina Maria L
Purchase Details
Closed on
Oct 3, 2013
Sold by
Perich Thomas J and Perich Debra R
Bought by
Flores Home Builders Llc
Create a Home Valuation Report for This Property
The Home Valuation Report is an in-depth analysis detailing your home's value as well as a comparison with similar homes in the area
Home Values in the Area
Average Home Value in this Area
Purchase History
| Date | Buyer | Sale Price | Title Company |
|---|---|---|---|
| Agua Buena Llc | -- | None Available | |
| Hang Xiao | -- | None Available | |
| Ngheim Phong | -- | Stewart Title | |
| Molina Maria L | -- | None Available | |
| Flores Home Builders Llc | -- | Momentum Title Llc |
Source: Public Records
Mortgage History
| Date | Status | Borrower | Loan Amount |
|---|---|---|---|
| Previous Owner | Ngheim Phong | $145,600 |
Source: Public Records
Tax History Compared to Growth
Tax History
| Year | Tax Paid | Tax Assessment Tax Assessment Total Assessment is a certain percentage of the fair market value that is determined by local assessors to be the total taxable value of land and additions on the property. | Land | Improvement |
|---|---|---|---|---|
| 2025 | $2,690 | $192,724 | $97,929 | $94,795 |
| 2024 | $2,690 | $196,826 | $97,929 | $98,897 |
| 2023 | $2,690 | $198,895 | $94,770 | $104,125 |
| 2022 | $2,673 | $158,193 | $73,710 | $84,483 |
| 2021 | $2,572 | $119,888 | $38,610 | $81,278 |
| 2020 | $2,429 | $112,120 | $38,610 | $73,510 |
| 2019 | $2,308 | $112,729 | $38,610 | $74,119 |
| 2018 | $1,385 | $82,914 | $28,080 | $54,834 |
| 2017 | $2,097 | $82,914 | $28,080 | $54,834 |
| 2016 | $1,987 | $78,571 | $28,080 | $50,491 |
| 2015 | $1,389 | $75,942 | $28,080 | $47,862 |
| 2014 | $1,389 | $75,942 | $28,080 | $47,862 |
Source: Public Records
Map
Nearby Homes
- 129 E Sunnyside St
- 401 Cresline St
- 153 Treasure Dr
- 107 Parker Rd
- 11018 Clark Rd
- 513 Mayford St
- 606 Cresline St
- 59 E Sunnyside St
- 11018 Catamore St
- 11026 Catamore St
- 10245 O Donnell Dr
- 283 Turner Dr
- 7 Parker Rd Unit 12
- 11334 Carla St
- 207 Dipping Stream St
- 11313 Stonework Grove Ln
- 11315 Stonework Grove Ln
- 10202 Fulton St
- 11320 Stonework Garden Ln
- 11317 Stonework Grove Ln
- 234 Parker Rd
- 226 Parker Rd
- 238 Parker Rd
- 222 Parker Rd
- 225 Wellington St
- 221 Wellington St
- 229 Wellington St
- 217 Wellington St
- 218 Parker Rd
- 229 Parker Rd
- 225 Parker Rd
- 233 Parker Rd
- 221 Parker Rd
- 237 Parker Rd
- 213 Wellington St
- 214 Parker Rd
- 246 Parker Rd
- 15819 Cooper Rd
- 217 Parker Rd
- 241 Parker Rd