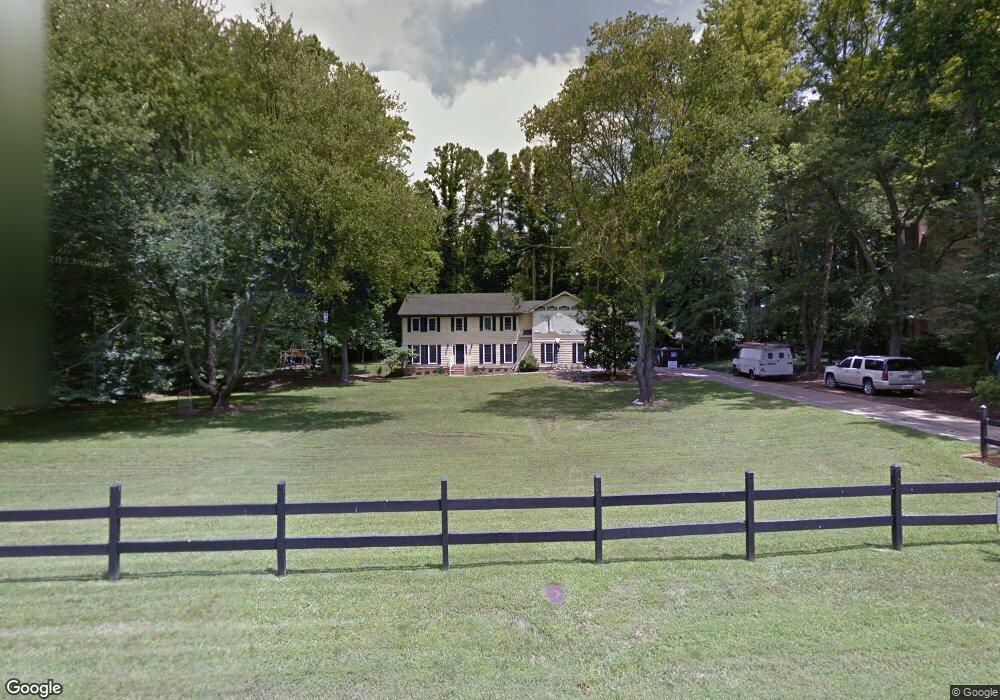
230 Pinebrook Way Roswell, GA 30076
Estimated Value: $723,000 - $857,000
4
Beds
3
Baths
3,260
Sq Ft
$239/Sq Ft
Est. Value
About This Home
This home is located at 230 Pinebrook Way, Roswell, GA 30076 and is currently estimated at $779,394, approximately $239 per square foot. 230 Pinebrook Way is a home located in Fulton County with nearby schools including Hembree Springs Elementary School, Elkins Pointe Middle School, and Fulton Academy of Science and Technology.
Ownership History
Date
Name
Owned For
Owner Type
Purchase Details
Closed on
Jun 15, 2001
Sold by
Hurley Dorothy C
Bought by
Davis Gregory
Current Estimated Value
Home Financials for this Owner
Home Financials are based on the most recent Mortgage that was taken out on this home.
Original Mortgage
$209,600
Outstanding Balance
$79,374
Interest Rate
7.06%
Mortgage Type
New Conventional
Estimated Equity
$700,020
Purchase Details
Closed on
Jun 25, 1998
Sold by
Curley Dorothy C
Bought by
Curley Dorothy C
Home Financials for this Owner
Home Financials are based on the most recent Mortgage that was taken out on this home.
Original Mortgage
$135,200
Interest Rate
6.97%
Mortgage Type
New Conventional
Purchase Details
Closed on
Sep 26, 1994
Sold by
Wadsworth Gordon H Janet A
Bought by
Curley Dorothy C
Home Financials for this Owner
Home Financials are based on the most recent Mortgage that was taken out on this home.
Original Mortgage
$135,000
Interest Rate
7.75%
Create a Home Valuation Report for This Property
The Home Valuation Report is an in-depth analysis detailing your home's value as well as a comparison with similar homes in the area
Home Values in the Area
Average Home Value in this Area
Purchase History
| Date | Buyer | Sale Price | Title Company |
|---|---|---|---|
| Davis Gregory | $262,000 | -- | |
| Curley Dorothy C | -- | -- | |
| Curley Dorothy C | $150,000 | -- |
Source: Public Records
Mortgage History
| Date | Status | Borrower | Loan Amount |
|---|---|---|---|
| Open | Davis Gregory | $209,600 | |
| Previous Owner | Curley Dorothy C | $135,200 | |
| Previous Owner | Curley Dorothy C | $135,000 |
Source: Public Records
Tax History Compared to Growth
Tax History
| Year | Tax Paid | Tax Assessment Tax Assessment Total Assessment is a certain percentage of the fair market value that is determined by local assessors to be the total taxable value of land and additions on the property. | Land | Improvement |
|---|---|---|---|---|
| 2025 | $1,329 | $249,200 | $77,640 | $171,560 |
| 2023 | $7,010 | $248,360 | $26,760 | $221,600 |
| 2022 | $4,948 | $188,080 | $27,080 | $161,000 |
| 2021 | $5,599 | $175,800 | $23,200 | $152,600 |
| 2020 | $5,479 | $167,320 | $22,080 | $145,240 |
| 2019 | $922 | $186,000 | $21,200 | $164,800 |
| 2018 | $4,387 | $155,440 | $28,560 | $126,880 |
| 2017 | $2,790 | $95,640 | $12,760 | $82,880 |
| 2016 | $2,791 | $95,640 | $12,760 | $82,880 |
| 2015 | $3,324 | $95,640 | $12,760 | $82,880 |
| 2014 | $2,932 | $95,640 | $12,760 | $82,880 |
Source: Public Records
Map
Nearby Homes
- 220 Hollyberry Dr
- 220 Hollyberry Ct
- 600 Rounsaville Rd
- 225 Maison Ct
- 11260 Houze Rd
- 230 Bluff Oak Dr
- 300 Saddle Creek Ln
- 1110 Arya Dr
- 1055 Wellers Ct
- 5022 Towneship Creek Rd
- 120 Gala Ct
- 425 Houze Way
- 400 Robin Ct Unit 5
- 1115 Primrose Dr
- 565 Camber Woods Dr
- 1012 Towneship Way
- 530 Camber Woods Dr
- 1000 Sterling Ct
- 110 Great Oaks Ln
- 240 Pinebrook Way Unit I
- 220 Pinebrook Way
- 545 Hembree Rd
- 235 Pinebrook Way
- 250 Pinebrook Way
- 225 Pinebrook Way Unit 1
- 245 Pinebrook Way
- 210 Pinebrook Way
- 565 Hembree Rd Unit 1
- 215 Pinebrook Way Unit 1
- 255 Pinebrook Way
- 205 Pinebrook Way
- 575 Hembree Rd
- 535 Hembree Rd
- 250 Hollyberry Ln
- 11535 Strickland Rd Unit 1
- 265 Pinebrook Way
- 260 Hollyberry Ln
- 0 Hollyberry Ln Unit 7556169
- 0 Hollyberry Ln Unit 3143708