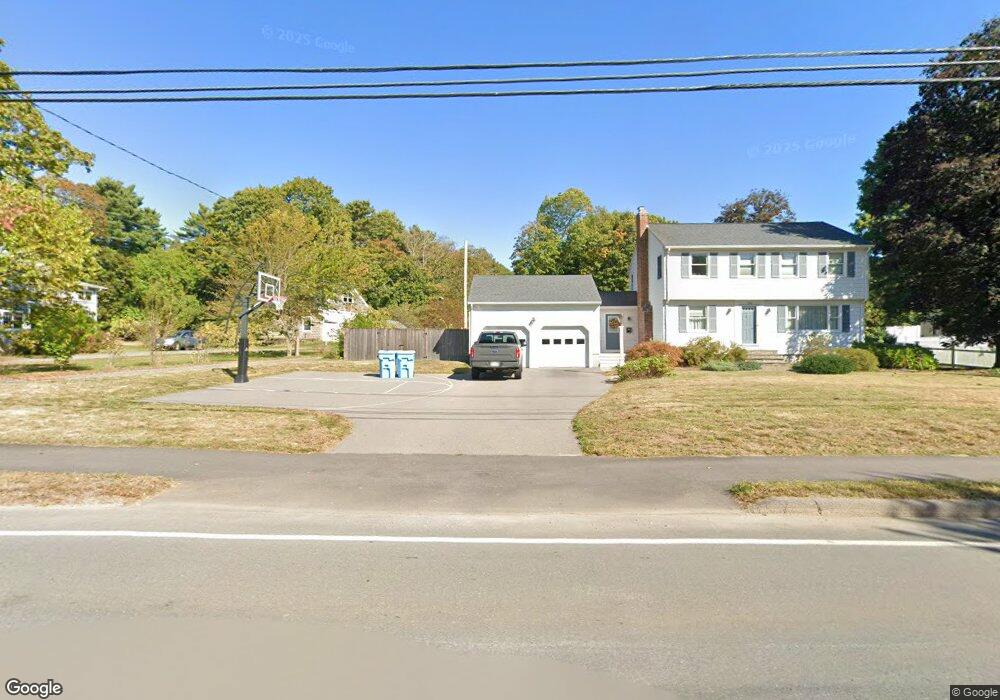
230 Plain St Millis, MA 02054
Estimated Value: $445,000 - $540,000
2
Beds
1
Bath
1,100
Sq Ft
$460/Sq Ft
Est. Value
About This Home
This home is located at 230 Plain St, Millis, MA 02054 and is currently estimated at $505,977, approximately $459 per square foot. 230 Plain St is a home located in Norfolk County with nearby schools including Clyde F Brown, Millis Middle School, and Millis High School.
Ownership History
Date
Name
Owned For
Owner Type
Purchase Details
Closed on
Sep 1, 2020
Sold by
Chiler Travis and Chiler Melanie M
Bought by
Shepherd Charles J and Shepherd Cindy M
Current Estimated Value
Purchase Details
Closed on
May 30, 2008
Sold by
Spillane Cheryl A and Spillane Mark E
Bought by
Kelly Melanie M and Chiler Travis
Home Financials for this Owner
Home Financials are based on the most recent Mortgage that was taken out on this home.
Original Mortgage
$185,000
Interest Rate
5.91%
Mortgage Type
Purchase Money Mortgage
Purchase Details
Closed on
May 19, 2003
Sold by
Power Justin F and Power Marie L
Bought by
Spillane Cheryl A and Spillane Mark E
Home Financials for this Owner
Home Financials are based on the most recent Mortgage that was taken out on this home.
Original Mortgage
$176,800
Interest Rate
5.84%
Mortgage Type
Purchase Money Mortgage
Create a Home Valuation Report for This Property
The Home Valuation Report is an in-depth analysis detailing your home's value as well as a comparison with similar homes in the area
Home Values in the Area
Average Home Value in this Area
Purchase History
| Date | Buyer | Sale Price | Title Company |
|---|---|---|---|
| Shepherd Charles J | $200,000 | None Available | |
| Kelly Melanie M | $200,000 | -- | |
| Spillane Cheryl A | $221,000 | -- |
Source: Public Records
Mortgage History
| Date | Status | Borrower | Loan Amount |
|---|---|---|---|
| Previous Owner | Kelly Melanie M | $185,000 | |
| Previous Owner | Spillane Cheryl A | $176,800 |
Source: Public Records
Tax History
| Year | Tax Paid | Tax Assessment Tax Assessment Total Assessment is a certain percentage of the fair market value that is determined by local assessors to be the total taxable value of land and additions on the property. | Land | Improvement |
|---|---|---|---|---|
| 2025 | $7,339 | $447,500 | $245,300 | $202,200 |
| 2024 | $6,960 | $423,900 | $226,500 | $197,400 |
| 2023 | $6,174 | $353,000 | $180,500 | $172,500 |
| 2022 | $6,653 | $352,400 | $193,700 | $158,700 |
| 2021 | $5,817 | $296,500 | $167,400 | $129,100 |
| 2020 | $5,750 | $285,500 | $156,400 | $129,100 |
| 2019 | $5,116 | $273,600 | $144,500 | $129,100 |
| 2018 | $4,930 | $273,600 | $144,500 | $129,100 |
| 2017 | $4,695 | $254,900 | $131,000 | $123,900 |
| 2016 | $4,445 | $254,900 | $131,000 | $123,900 |
| 2015 | $4,333 | $254,900 | $131,000 | $123,900 |
Source: Public Records
Map
Nearby Homes
Your Personal Tour Guide
Ask me questions while you tour the home.