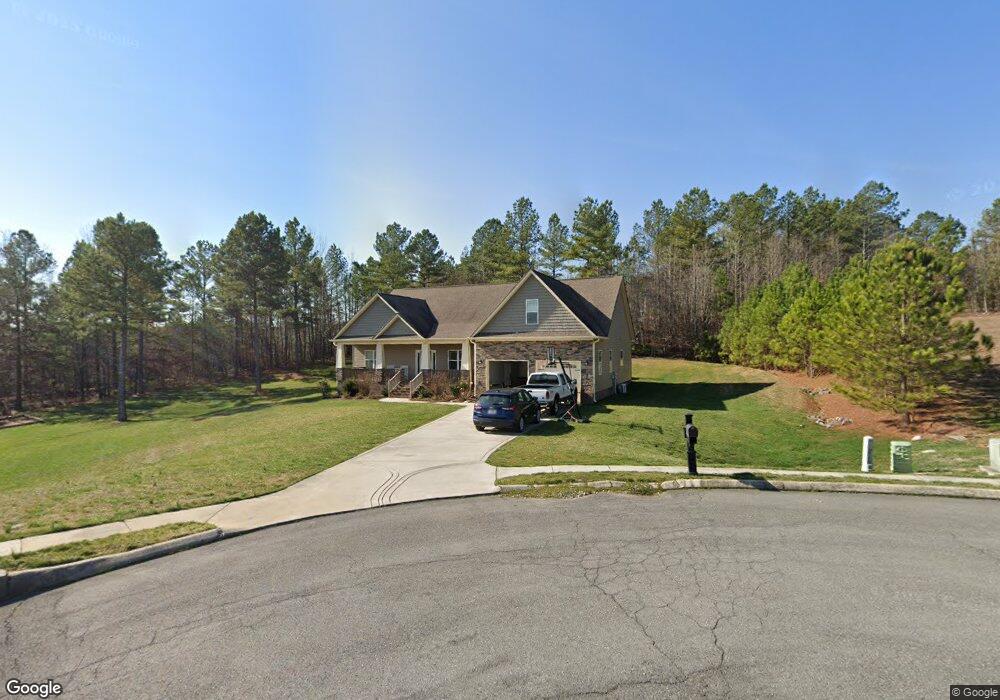
230 Revere Run Tunnel Hill, GA 30755
Estimated Value: $433,000 - $495,000
--
Bed
--
Bath
2,244
Sq Ft
$202/Sq Ft
Est. Value
About This Home
This home is located at 230 Revere Run, Tunnel Hill, GA 30755 and is currently estimated at $454,073, approximately $202 per square foot. 230 Revere Run is a home with nearby schools including New Hope Elementary School, New Hope Middle School, and Northwest Whitfield County High School.
Ownership History
Date
Name
Owned For
Owner Type
Purchase Details
Closed on
Dec 15, 2015
Sold by
Vineyard Marvin A
Bought by
Gabehart John Derek and Gabehart Susan Abigail
Current Estimated Value
Home Financials for this Owner
Home Financials are based on the most recent Mortgage that was taken out on this home.
Original Mortgage
$196,000
Outstanding Balance
$155,569
Interest Rate
3.98%
Mortgage Type
New Conventional
Estimated Equity
$298,504
Purchase Details
Closed on
Jun 1, 2012
Sold by
Vinyard Construction Llc
Bought by
Vinyard Marvin A
Home Financials for this Owner
Home Financials are based on the most recent Mortgage that was taken out on this home.
Original Mortgage
$34,531
Interest Rate
3.84%
Mortgage Type
New Conventional
Purchase Details
Closed on
Apr 27, 2012
Sold by
Wright Darren
Bought by
Vinyard Construction Llc
Home Financials for this Owner
Home Financials are based on the most recent Mortgage that was taken out on this home.
Original Mortgage
$34,531
Interest Rate
3.84%
Mortgage Type
New Conventional
Create a Home Valuation Report for This Property
The Home Valuation Report is an in-depth analysis detailing your home's value as well as a comparison with similar homes in the area
Home Values in the Area
Average Home Value in this Area
Purchase History
| Date | Buyer | Sale Price | Title Company |
|---|---|---|---|
| Gabehart John Derek | $30,000 | -- | |
| Vinyard Marvin A | $32,900 | -- | |
| Vinyard Construction Llc | $40,000 | -- |
Source: Public Records
Mortgage History
| Date | Status | Borrower | Loan Amount |
|---|---|---|---|
| Open | Gabehart John Derek | $196,000 | |
| Previous Owner | Vinyard Marvin A | $34,531 |
Source: Public Records
Tax History Compared to Growth
Tax History
| Year | Tax Paid | Tax Assessment Tax Assessment Total Assessment is a certain percentage of the fair market value that is determined by local assessors to be the total taxable value of land and additions on the property. | Land | Improvement |
|---|---|---|---|---|
| 2024 | $4,204 | $186,267 | $19,200 | $167,067 |
| 2023 | $4,204 | $131,609 | $14,000 | $117,609 |
| 2022 | $3,358 | $105,542 | $14,000 | $91,542 |
| 2021 | $3,361 | $105,542 | $14,000 | $91,542 |
| 2020 | $3,467 | $105,542 | $14,000 | $91,542 |
| 2019 | $3,521 | $105,542 | $14,000 | $91,542 |
| 2018 | $3,579 | $105,542 | $14,000 | $91,542 |
| 2017 | $3,581 | $105,542 | $14,000 | $91,542 |
| 2016 | $327 | $14,000 | $14,000 | $0 |
| 2014 | $293 | $10,000 | $10,000 | $0 |
| 2013 | -- | $10,000 | $10,000 | $0 |
Source: Public Records
Map
Nearby Homes
- 181 Revere Run
- 228 Vineyard Dr
- 179 Treadstone Dr
- 463 Treadstone Dr
- 405 Treadstone Dr
- The Harrington Plan at Varnell Preserve
- The Bradley Plan at Varnell Preserve
- The Braselton II Plan at Varnell Preserve
- The Lawson Plan at Varnell Preserve
- The Caldwell Plan at Varnell Preserve
- The McGinnis Plan at Varnell Preserve
- The Benson II Plan at Varnell Preserve
- The Coleman Plan at Varnell Preserve
- 151 Orion Dr
- 1377 Dustin Dr
- 0 Tunnel Hill Varnell Rd
- 1359 Dustin Dr
- 198 Artimis Dr
- 1433 Dustin Dr
- 1458 Dustin Dr
- 240 Revere Run
- 178 Revere Run
- 221 Revere Run
- 203 Revere Run
- 155 Revere Run
- 0 Revere Run
- 134 Revere Run
- 1170 New Hope Rd NW
- 224 Vineyard Dr
- 224 Vineyard Dr
- 3010 Reed Rd
- 131 Revere Run
- 218 Vineyard Dr
- 218 Vineyard Dr
- 1480 New Hope Rd
- 1470 New Hope Church Rd
- 214 Vineyard Dr
- 111 Revere Run
- 225 Vineyard Dr
- 221 Vineyard Dr