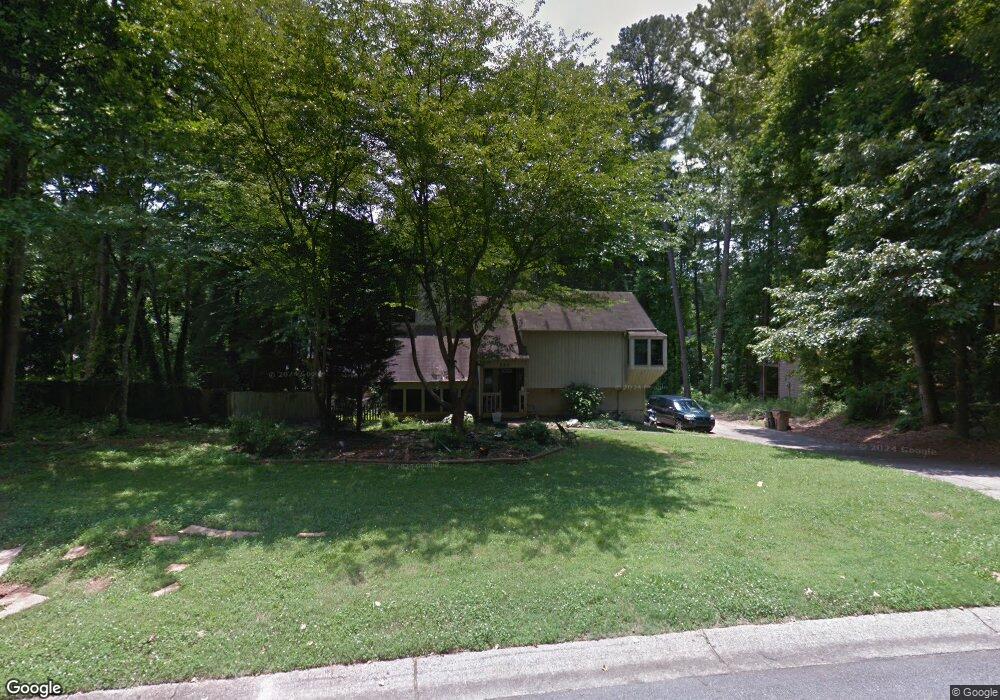
230 Rocky Top Ct NE Unit 1 Kennesaw, GA 30144
Estimated Value: $300,000 - $346,241
5
Beds
3
Baths
1,276
Sq Ft
$259/Sq Ft
Est. Value
About This Home
This home is located at 230 Rocky Top Ct NE Unit 1, Kennesaw, GA 30144 and is currently estimated at $330,560, approximately $259 per square foot. 230 Rocky Top Ct NE Unit 1 is a home located in Cobb County with nearby schools including Blackwell Elementary School, McCleskey Middle School, and Kell High School.
Ownership History
Date
Name
Owned For
Owner Type
Purchase Details
Closed on
Jan 27, 2006
Sold by
Lanier James S and Lanier Lisa S
Bought by
Hicks-Vargas Carol and Vargas Michael
Current Estimated Value
Home Financials for this Owner
Home Financials are based on the most recent Mortgage that was taken out on this home.
Original Mortgage
$148,000
Outstanding Balance
$83,367
Interest Rate
6.21%
Mortgage Type
Trade
Estimated Equity
$247,193
Purchase Details
Closed on
Aug 29, 2002
Sold by
O'Connor Lila
Bought by
Lanier James S and Lanier Lisa S
Home Financials for this Owner
Home Financials are based on the most recent Mortgage that was taken out on this home.
Original Mortgage
$102,240
Interest Rate
6.1%
Mortgage Type
New Conventional
Purchase Details
Closed on
Aug 7, 1995
Sold by
Wilbourn Warner J
Bought by
Lilly Lila Anne
Create a Home Valuation Report for This Property
The Home Valuation Report is an in-depth analysis detailing your home's value as well as a comparison with similar homes in the area
Home Values in the Area
Average Home Value in this Area
Purchase History
| Date | Buyer | Sale Price | Title Company |
|---|---|---|---|
| Hicks-Vargas Carol | $149,000 | -- | |
| Lanier James S | $127,800 | -- | |
| Lilly Lila Anne | $4,700 | -- |
Source: Public Records
Mortgage History
| Date | Status | Borrower | Loan Amount |
|---|---|---|---|
| Open | Hicks-Vargas Carol | $148,000 | |
| Previous Owner | Lanier James S | $102,240 | |
| Closed | Lilly Lila Anne | $0 |
Source: Public Records
Tax History Compared to Growth
Tax History
| Year | Tax Paid | Tax Assessment Tax Assessment Total Assessment is a certain percentage of the fair market value that is determined by local assessors to be the total taxable value of land and additions on the property. | Land | Improvement |
|---|---|---|---|---|
| 2024 | $2,779 | $121,376 | $25,600 | $95,776 |
| 2023 | $2,153 | $117,532 | $25,600 | $91,932 |
| 2022 | $2,256 | $96,460 | $22,000 | $74,460 |
| 2021 | $1,918 | $81,004 | $18,000 | $63,004 |
| 2020 | $1,788 | $75,048 | $14,400 | $60,648 |
| 2019 | $1,589 | $65,960 | $14,400 | $51,560 |
| 2018 | $1,589 | $65,960 | $14,400 | $51,560 |
| 2017 | $1,478 | $63,676 | $14,400 | $49,276 |
| 2016 | $768 | $35,592 | $14,400 | $21,192 |
| 2015 | $788 | $35,592 | $14,400 | $21,192 |
| 2014 | $795 | $35,592 | $0 | $0 |
Source: Public Records
Map
Nearby Homes
- 0 Watkins Glen Dr NE Unit 10506865
- 0 Watkins Glen Dr NE Unit 7564156
- 0 Lake Latimer Dr NE Unit 10506857
- 44 Lake Latimer Dr NE
- 46 Lake Latimer Dr NE
- 48 Lake Latimer Dr NE
- 0 Lake Latimer Dr NE Unit 7564947
- 163 Castleair Ct NE
- 4699 N View Rd NW Unit 1
- 4699 N View Rd NW
- 4904 Shallow Creek Trail NW
- 4903 Shallow Creek Trail NW
- 95 Simpson Dr NE
- 4825 Shallow Creek Dr NW
- 4834 Shallow Creek Dr NW
- 4992 Shallow Ridge Rd NE
- 2111 Yorkshire Ct
- 1816 Yorkshire Dr
- 2108 Yorkshire Ct
- 220 Rocky Top Ct NE Unit 1
- 225 Watkins Glen Dr NE Unit 1
- 0 Rocky Top Ct NE
- 240 Rocky Top Ct NE Unit 1
- 215 Watkins Glen Dr NE
- 210 Rocky Top Ct NE Unit 1
- 229 Rocky Top Ct NE
- 239 Rocky Top Ct NE
- 50 Lake Latimer Dr NE
- 52 Lake Latimer Dr NE
- 249 Rocky Top Ct NE
- 209 Rocky Top Ct NE
- 54 Lake Latimer Dr NE
- 205 Watkins Glen Dr NE
- 219 Rocky Top Ct NE Unit 1
- 0 Watkins Glen Dr NE Unit 8145134
- 0 Watkins Glen Dr NE
- 56 Lake Latimer Dr NE Unit 2
- 0 Lake Latimer Dr NE Unit 7072703
- 0 Lake Latimer Dr NE Unit 7421544