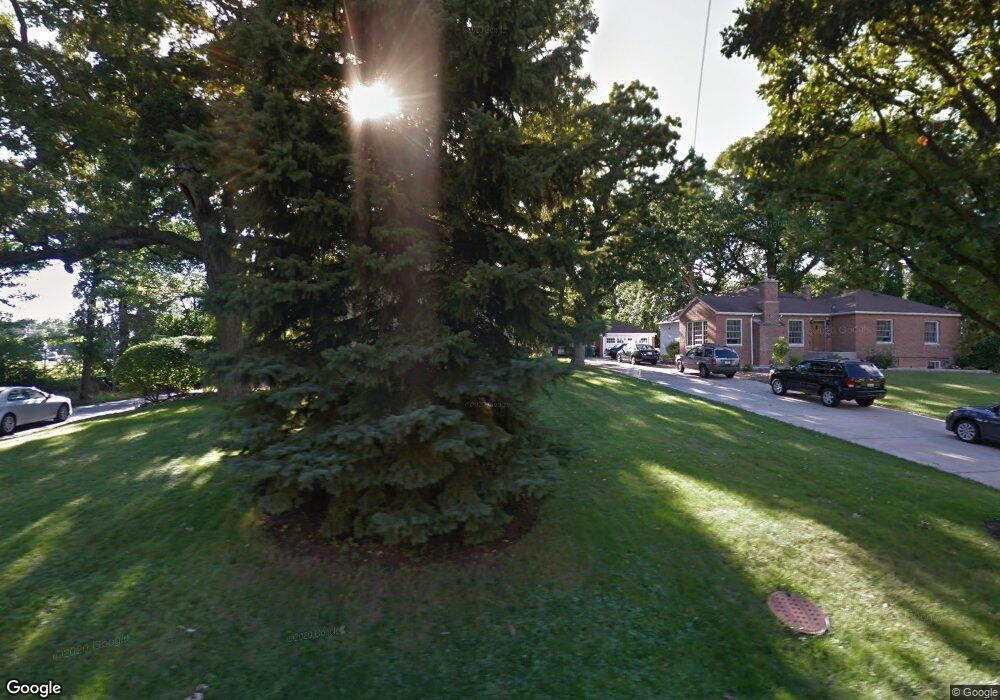
230 S Slusser St Grayslake, IL 60030
Estimated Value: $397,000
3
Beds
2
Baths
2,138
Sq Ft
$186/Sq Ft
Est. Value
About This Home
This home is located at 230 S Slusser St, Grayslake, IL 60030 and is currently estimated at $397,000, approximately $185 per square foot. 230 S Slusser St is a home located in Lake County with nearby schools including Woodview School, Frederick School, and Grayslake Middle School.
Ownership History
Date
Name
Owned For
Owner Type
Purchase Details
Closed on
Feb 5, 2024
Sold by
Bryant Jane D and Bryant Peter J
Bought by
Bryant Klett Family Trust and Klett
Current Estimated Value
Purchase Details
Closed on
Jul 14, 2015
Sold by
Bryant Jane D and Klett Peter J
Bought by
Bryant Jane D and Klett Peter J
Home Financials for this Owner
Home Financials are based on the most recent Mortgage that was taken out on this home.
Original Mortgage
$181,795
Interest Rate
3.88%
Mortgage Type
New Conventional
Purchase Details
Closed on
Oct 29, 1993
Sold by
Geary Norman C and Geary Marilyn H
Bought by
Bryant Dennis and Bryant Jane D
Home Financials for this Owner
Home Financials are based on the most recent Mortgage that was taken out on this home.
Original Mortgage
$161,850
Interest Rate
6.92%
Create a Home Valuation Report for This Property
The Home Valuation Report is an in-depth analysis detailing your home's value as well as a comparison with similar homes in the area
Home Values in the Area
Average Home Value in this Area
Purchase History
| Date | Buyer | Sale Price | Title Company |
|---|---|---|---|
| Bryant Klett Family Trust | -- | None Listed On Document | |
| Bryant Jane D | -- | None Available | |
| Bryant Dennis | $116,666 | Chicago Title Insurance Co |
Source: Public Records
Mortgage History
| Date | Status | Borrower | Loan Amount |
|---|---|---|---|
| Previous Owner | Bryant Jane D | $181,795 | |
| Previous Owner | Bryant Dennis | $161,850 |
Source: Public Records
Tax History Compared to Growth
Tax History
| Year | Tax Paid | Tax Assessment Tax Assessment Total Assessment is a certain percentage of the fair market value that is determined by local assessors to be the total taxable value of land and additions on the property. | Land | Improvement |
|---|---|---|---|---|
| 2024 | $12,345 | $123,092 | $25,717 | $97,375 |
| 2023 | $13,474 | $112,970 | $23,602 | $89,368 |
| 2022 | $13,474 | $118,366 | $9,663 | $108,703 |
| 2021 | $13,325 | $113,770 | $9,288 | $104,482 |
| 2020 | $13,332 | $108,249 | $8,837 | $99,412 |
| 2019 | $12,878 | $103,856 | $8,478 | $95,378 |
| 2018 | $12,884 | $104,525 | $22,756 | $81,769 |
| 2017 | $12,820 | $98,321 | $21,405 | $76,916 |
| 2016 | $12,319 | $90,761 | $19,759 | $71,002 |
| 2015 | $12,024 | $82,917 | $18,051 | $64,866 |
| 2014 | $9,943 | $77,652 | $15,884 | $61,768 |
| 2012 | $9,803 | $81,099 | $16,589 | $64,510 |
Source: Public Records
Map
Nearby Homes
- 121 Park Ave
- 349 Brittain Ave
- 10 Glen St
- 146 Westerfield Place
- 11 S Lake St
- 101 Burton St
- 220 Bluff Ct
- 533 Cannon Ball Dr
- 102 Soo Line Dr
- 390 N Garfield Blvd
- 231 Lionel Dr
- 42 Village Station Ln
- 270 Lionel Dr
- 34110 S Circle Dr
- 228 Station Park Cir
- Lot 48 Lake Ave
- 32100 Alleghany Rd
- 26155 W Il Route 120
- 337 Woodland Dr Unit 6
- 230 N Alleghany Rd
- 240 S Slusser St
- 31 Junior Ave
- 208 S Slusser St
- 21 Junior Ave
- 227 S Slusser St
- 217 S Lake St
- 231 S Slusser St
- 223 S Slusser St
- 237 S Slusser St
- 219 S Slusser St
- 243 S Slusser St
- 201 S Lake St
- 249 S Slusser St
- 207 S Slusser St
- 257 S Slusser St
- 240 S Lake St
- 102 Junior Ave
- 2 Junior Ave
- 234 S Lake St
- 226 S Lake St