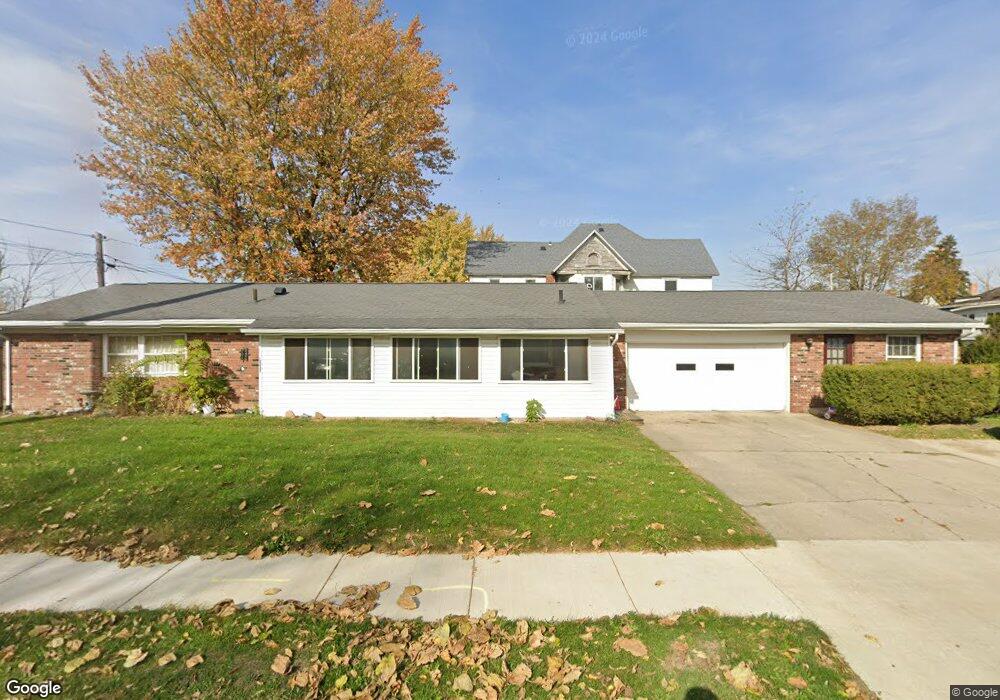
230 S Walnut St Hartford City, IN 47348
Estimated Value: $123,000 - $165,208
3
Beds
2
Baths
1,850
Sq Ft
$78/Sq Ft
Est. Value
About This Home
This home is located at 230 S Walnut St, Hartford City, IN 47348 and is currently estimated at $143,802, approximately $77 per square foot. 230 S Walnut St is a home located in Blackford County with nearby schools including Blackford Primary School, Southside Elementary School, and Blackford Junior High School.
Ownership History
Date
Name
Owned For
Owner Type
Purchase Details
Closed on
Aug 23, 2005
Sold by
Markin June E
Bought by
Mitchell Russell E and Mitchell Brenda S
Current Estimated Value
Home Financials for this Owner
Home Financials are based on the most recent Mortgage that was taken out on this home.
Original Mortgage
$79,000
Outstanding Balance
$41,926
Interest Rate
5.82%
Mortgage Type
Purchase Money Mortgage
Estimated Equity
$101,876
Create a Home Valuation Report for This Property
The Home Valuation Report is an in-depth analysis detailing your home's value as well as a comparison with similar homes in the area
Home Values in the Area
Average Home Value in this Area
Purchase History
| Date | Buyer | Sale Price | Title Company |
|---|---|---|---|
| Mitchell Russell E | -- | None Available | |
| Markin June E | -- | None Available |
Source: Public Records
Mortgage History
| Date | Status | Borrower | Loan Amount |
|---|---|---|---|
| Open | Mitchell Russell E | $79,000 |
Source: Public Records
Tax History Compared to Growth
Tax History
| Year | Tax Paid | Tax Assessment Tax Assessment Total Assessment is a certain percentage of the fair market value that is determined by local assessors to be the total taxable value of land and additions on the property. | Land | Improvement |
|---|---|---|---|---|
| 2024 | $1,319 | $129,900 | $10,500 | $119,400 |
| 2023 | $1,170 | $116,400 | $7,700 | $108,700 |
| 2022 | $1,007 | $98,100 | $7,700 | $90,400 |
| 2021 | $883 | $85,700 | $7,700 | $78,000 |
| 2020 | $825 | $79,900 | $7,700 | $72,200 |
| 2019 | $861 | $83,500 | $7,700 | $75,800 |
| 2018 | $852 | $82,600 | $7,700 | $74,900 |
| 2017 | $681 | $76,500 | $7,700 | $68,800 |
| 2016 | $675 | $76,500 | $7,700 | $68,800 |
| 2014 | $606 | $73,800 | $7,700 | $66,100 |
| 2013 | $606 | $73,100 | $7,700 | $65,400 |
Source: Public Records
Map
Nearby Homes
- 215 S High St
- 517 S Richmond St
- 505 S High St
- 219 W Kickapoo St
- 408 W Kickapoo St
- 415 N Cherry St
- 323 E Commercial St
- 607 S Jefferson St
- 130 S Ford St
- 615 W Kickapoo St
- 816 W Chestnut St
- 514 W Grant St
- 811 W Kickapoo St
- 516 E Chestnut St
- 709 N Walnut St
- 620 E Main St
- 819 N Walnut St
- 1533 W Water St
- 1008 W Elm St
- 421 E North St
- 220 S Walnut St
- 302 S Walnut St
- 219 S Cherry St
- 217 S Walnut St
- 225 S Cherry St
- 301 S Walnut St
- 209 S Walnut St
- 202 S Walnut St
- 207 S Walnut St Unit 209
- 207 209 S Walnut
- 310 S Walnut St
- 321 W Chestnut St
- 224 W Chestnut St
- 225 W Chestnut St
- 201 S Walnut St
- 311 S Walnut St
- 201 S Cherry St
- 222 S Cherry St
- 214 S Cherry St
- 221 W Chestnut St