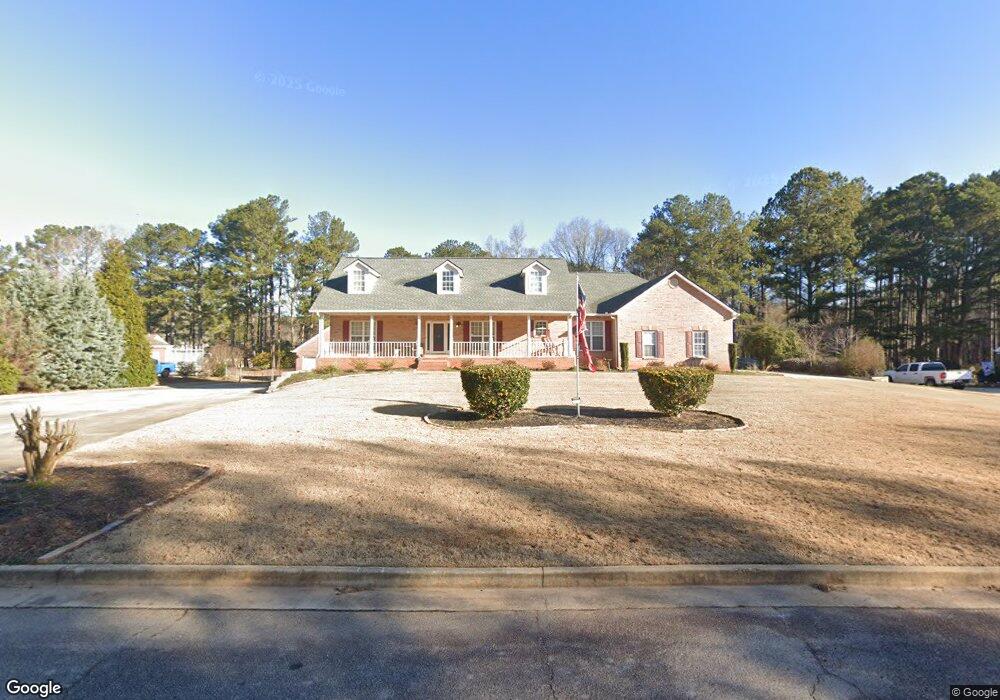
230 Valley Way Hampton, GA 30228
Estimated Value: $405,000 - $521,000
6
Beds
6
Baths
4,894
Sq Ft
$93/Sq Ft
Est. Value
About This Home
This home is located at 230 Valley Way, Hampton, GA 30228 and is currently estimated at $454,791, approximately $92 per square foot. 230 Valley Way is a home located in Henry County with nearby schools including Rocky Creek Elementary School, Hampton Middle School, and Hampton High School.
Ownership History
Date
Name
Owned For
Owner Type
Purchase Details
Closed on
Jul 3, 2017
Sold by
Coker William J
Bought by
Riley Jason and Riley Adrione
Current Estimated Value
Home Financials for this Owner
Home Financials are based on the most recent Mortgage that was taken out on this home.
Original Mortgage
$326,880
Outstanding Balance
$271,298
Interest Rate
3.94%
Mortgage Type
VA
Estimated Equity
$183,493
Purchase Details
Closed on
Jun 29, 2007
Sold by
Martin Timothy B and Martin Melissa H
Bought by
Coker William J
Home Financials for this Owner
Home Financials are based on the most recent Mortgage that was taken out on this home.
Original Mortgage
$257,600
Interest Rate
6.35%
Mortgage Type
New Conventional
Purchase Details
Closed on
Apr 29, 1998
Sold by
Greer Jerry
Bought by
Simpson Charles and Simpson Lisa
Home Financials for this Owner
Home Financials are based on the most recent Mortgage that was taken out on this home.
Original Mortgage
$67,300
Interest Rate
7.03%
Mortgage Type
New Conventional
Create a Home Valuation Report for This Property
The Home Valuation Report is an in-depth analysis detailing your home's value as well as a comparison with similar homes in the area
Home Values in the Area
Average Home Value in this Area
Purchase History
| Date | Buyer | Sale Price | Title Company |
|---|---|---|---|
| Riley Jason | $320,000 | -- | |
| Coker William J | $322,000 | -- | |
| Simpson Charles | $180,000 | -- |
Source: Public Records
Mortgage History
| Date | Status | Borrower | Loan Amount |
|---|---|---|---|
| Open | Riley Jason | $326,880 | |
| Previous Owner | Coker William J | $257,600 | |
| Previous Owner | Simpson Charles | $67,300 |
Source: Public Records
Tax History
| Year | Tax Paid | Tax Assessment Tax Assessment Total Assessment is a certain percentage of the fair market value that is determined by local assessors to be the total taxable value of land and additions on the property. | Land | Improvement |
|---|---|---|---|---|
| 2025 | $5,828 | $195,960 | $16,000 | $179,960 |
| 2024 | $5,828 | $183,880 | $16,000 | $167,880 |
| 2023 | $5,105 | $175,080 | $14,000 | $161,080 |
| 2022 | $5,001 | $148,880 | $14,000 | $134,880 |
| 2021 | $4,361 | $122,680 | $14,000 | $108,680 |
| 2020 | $4,339 | $121,320 | $10,000 | $111,320 |
| 2019 | $4,170 | $114,440 | $10,000 | $104,440 |
| 2018 | $4,161 | $113,960 | $10,000 | $103,960 |
| 2016 | $3,637 | $100,120 | $9,600 | $90,520 |
| 2015 | $3,830 | $102,440 | $9,600 | $92,840 |
| 2014 | $3,538 | $94,080 | $8,000 | $86,080 |
Source: Public Records
Map
Nearby Homes
- 164 Turner Creek Dr
- 121 Turner Creek Dr
- 856 S Hampton Rd
- 239 Kyndal Dr
- 1205 Rocky Creek Rd
- 354 Cobblestone Ct
- 1007 S Hampton Rd
- 303 Millstone Dr
- 221 Millstone Dr
- 0 Hampton Locust Grove Rd Unit 10541409
- 230 Millstone Dr
- 1417 Stone Ridge Ct
- 1419 Stone Ridge Ct
- 1385 Pebble Ridge Dr
- 915 Rocky Creek Rd
- 879 Rocky Creek Rd
- 1220 S Hampton Rd
- 817 Smallwood Trace
- 162 Old Hampton Way
- 0 Hillview Rd Unit 10658863
- 236 Valley Way
- 158 Turner Creek Dr
- 229 Valley Way
- 242 Valley Way
- 152 Turner Creek Dr Unit 13
- 152 Turner Creek Dr
- 235 Valley Way
- 223 Valley Way
- 165 Turner Creek Dr
- 157 Turner Creek Dr
- 241 Valley Way
- 146 Turner Creek Dr
- 217 Valley Way
- 648 Hampton Locust Grove Rd
- 212 Valley Way
- 140 Turner Creek Dr
- 247 Valley Way
- 149 Turner Creek Dr
- 211 Valley Way
- 219 Valley Way
Your Personal Tour Guide
Ask me questions while you tour the home.