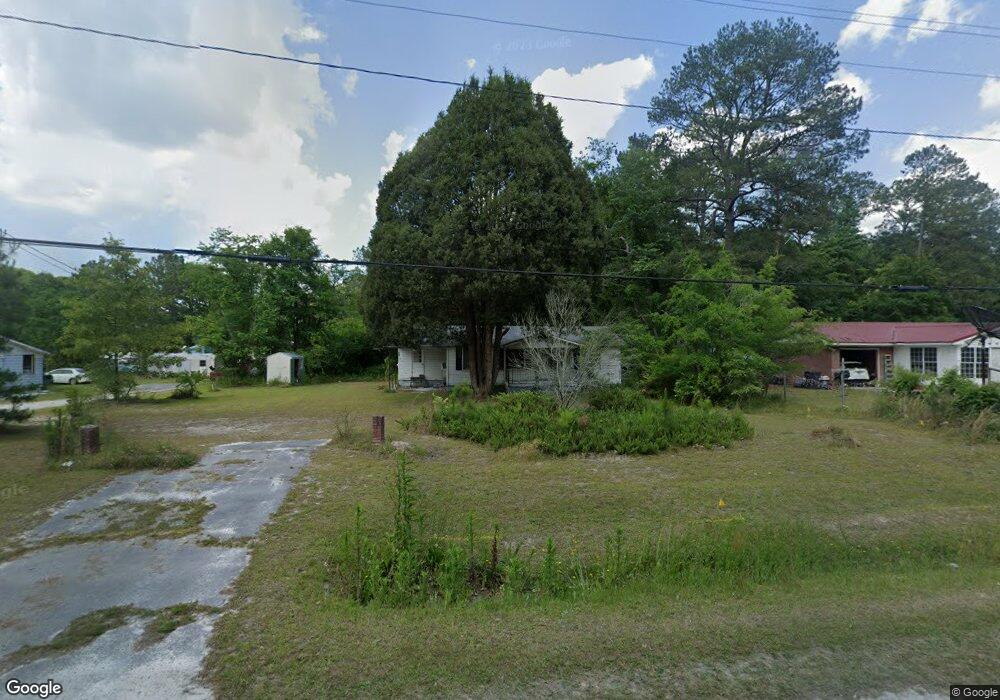
230 Vinson Rd Mc Intyre, GA 31054
Estimated Value: $65,489 - $133,000
2
Beds
1
Bath
864
Sq Ft
$119/Sq Ft
Est. Value
About This Home
This home is located at 230 Vinson Rd, Mc Intyre, GA 31054 and is currently estimated at $102,872, approximately $119 per square foot. 230 Vinson Rd is a home located in Wilkinson County with nearby schools including Wilkinson County Primary School, Wilkinson County Elementary School, and Wilkinson County Middle School.
Ownership History
Date
Name
Owned For
Owner Type
Purchase Details
Closed on
Mar 25, 1993
Sold by
Mapp Charlie L Estate & Robbie Lee Mapp
Bought by
Mapp Robbie Lee
Current Estimated Value
Create a Home Valuation Report for This Property
The Home Valuation Report is an in-depth analysis detailing your home's value as well as a comparison with similar homes in the area
Home Values in the Area
Average Home Value in this Area
Purchase History
| Date | Buyer | Sale Price | Title Company |
|---|---|---|---|
| Mapp Robbie Lee | -- | -- |
Source: Public Records
Tax History Compared to Growth
Tax History
| Year | Tax Paid | Tax Assessment Tax Assessment Total Assessment is a certain percentage of the fair market value that is determined by local assessors to be the total taxable value of land and additions on the property. | Land | Improvement |
|---|---|---|---|---|
| 2024 | $510 | $13,453 | $1,536 | $11,917 |
| 2023 | $258 | $9,652 | $1,564 | $8,088 |
| 2022 | $242 | $9,252 | $1,564 | $7,688 |
| 2021 | $245 | $9,252 | $1,564 | $7,688 |
| 2020 | $245 | $9,252 | $1,564 | $7,688 |
| 2019 | $245 | $9,252 | $1,564 | $7,688 |
| 2018 | $245 | $11,934 | $1,564 | $10,370 |
| 2017 | $323 | $11,934 | $1,564 | $10,370 |
| 2016 | $420 | $11,934 | $1,564 | $10,370 |
| 2015 | $307 | $11,934 | $1,564 | $10,370 |
| 2014 | $307 | $11,934 | $1,564 | $10,370 |
| 2013 | $307 | $11,934 | $1,564 | $10,370 |
Source: Public Records
Map
Nearby Homes
- 110 Magnolia Dr
- 0 Magnolia Dr
- 0 Davis Cemetery Rd
- 56 Claymont Rd
- 0 Asbell Rd
- --- Asbell Rd
- 9 Sunflower Rd
- 102 Asbell St
- 103 E Main St
- 00 Wriley Rd
- 15110 Georgia 57
- 498 White Springs Church Rd
- 88 Caroline Dr
- C T Lord Hwy
- 0 Industrial Blvd Unit 52833
- 137 Lakeview Dr S
- 0 Us-441 S
- 0 Laurel Branch Rd Unit 10587149
- 189 Pine St
- 116 Tasha Rd
- 232 Vinson Rd
- 228 Vinson Rd
- 226 Vinson Rd Unit B
- 226 Vinson Rd
- 234 Vinson Rd
- 236 Vinson Rd
- 220 Vinson Rd Unit B
- 220 Vinson Rd
- 220 Vinson Rd Unit B
- 220 Vinson Rd
- 238 Vinson Rd
- 244 Vinson Rd
- 246 Vinson Rd
- 239 Vinson Rd
- 248 Vinson Rd
- 248 Vinson Rd
- 248 Vinson Rd Unit B
- 204 Vinson Rd
- 254 Vinson Rd
- 254 Vinson Rd