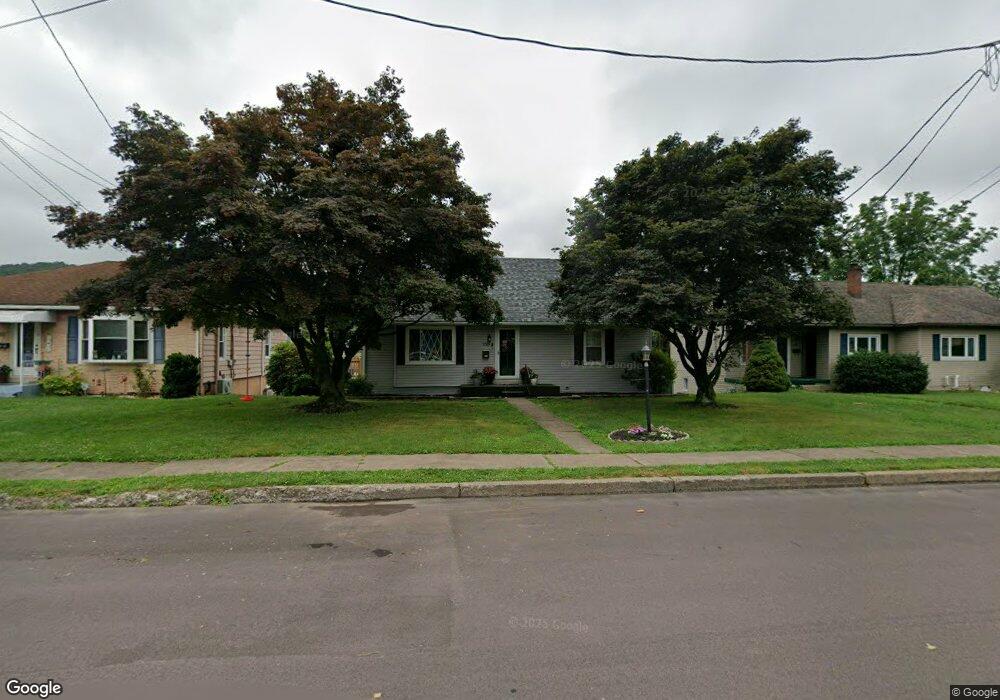
230 W 12th St Bloomsburg, PA 17815
Estimated Value: $254,000 - $274,000
3
Beds
3
Baths
1,764
Sq Ft
$152/Sq Ft
Est. Value
About This Home
This home is located at 230 W 12th St, Bloomsburg, PA 17815 and is currently estimated at $268,398, approximately $152 per square foot. 230 W 12th St is a home located in Columbia County with nearby schools including Memorial Elementary School, Bloomsburg Area Middle School, and Bloomsburg Area High School.
Ownership History
Date
Name
Owned For
Owner Type
Purchase Details
Closed on
Aug 23, 2022
Sold by
Billie Cardozo
Bought by
Derose Ashley M
Current Estimated Value
Home Financials for this Owner
Home Financials are based on the most recent Mortgage that was taken out on this home.
Original Mortgage
$134,000
Outstanding Balance
$128,111
Interest Rate
5.51%
Mortgage Type
New Conventional
Estimated Equity
$140,287
Purchase Details
Closed on
Dec 9, 2015
Sold by
Zeisloft Craig S
Bought by
Cardozo Billie
Home Financials for this Owner
Home Financials are based on the most recent Mortgage that was taken out on this home.
Original Mortgage
$109,406
Interest Rate
3.62%
Mortgage Type
FHA
Purchase Details
Closed on
Jan 25, 2008
Sold by
Noel Catherine and Considine Shawn
Bought by
Zeisloft Craig S
Home Financials for this Owner
Home Financials are based on the most recent Mortgage that was taken out on this home.
Original Mortgage
$127,600
Interest Rate
6.14%
Mortgage Type
New Conventional
Create a Home Valuation Report for This Property
The Home Valuation Report is an in-depth analysis detailing your home's value as well as a comparison with similar homes in the area
Home Values in the Area
Average Home Value in this Area
Purchase History
| Date | Buyer | Sale Price | Title Company |
|---|---|---|---|
| Derose Ashley M | $240,000 | Faxon Settlement Services | |
| Cardozo Billie | $113,200 | Attorney | |
| Zeisloft Craig S | $159,500 | None Available |
Source: Public Records
Mortgage History
| Date | Status | Borrower | Loan Amount |
|---|---|---|---|
| Open | Derose Ashley M | $134,000 | |
| Previous Owner | Cardozo Billie | $109,406 | |
| Previous Owner | Zeisloft Craig S | $127,600 |
Source: Public Records
Tax History Compared to Growth
Tax History
| Year | Tax Paid | Tax Assessment Tax Assessment Total Assessment is a certain percentage of the fair market value that is determined by local assessors to be the total taxable value of land and additions on the property. | Land | Improvement |
|---|---|---|---|---|
| 2025 | $2,309 | $25,593 | $0 | $0 |
| 2024 | $2,270 | $25,593 | $4,125 | $21,468 |
| 2023 | $2,104 | $25,593 | $4,125 | $21,468 |
| 2022 | $2,028 | $25,593 | $4,125 | $21,468 |
| 2021 | $1,985 | $25,593 | $4,125 | $21,468 |
| 2020 | $1,903 | $25,593 | $4,125 | $21,468 |
| 2019 | $1,843 | $25,213 | $4,125 | $21,088 |
| 2018 | $1,800 | $25,213 | $4,125 | $21,088 |
| 2017 | $1,708 | $25,213 | $4,125 | $21,088 |
| 2016 | -- | $25,213 | $4,125 | $21,088 |
| 2015 | -- | $25,213 | $4,125 | $21,088 |
| 2014 | -- | $25,213 | $4,125 | $21,088 |
Source: Public Records
Map
Nearby Homes