230 W 200 N Lagrange, IN 46761
Estimated Value: $390,556 - $420,000
4
Beds
2
Baths
2,400
Sq Ft
$168/Sq Ft
Est. Value
About This Home
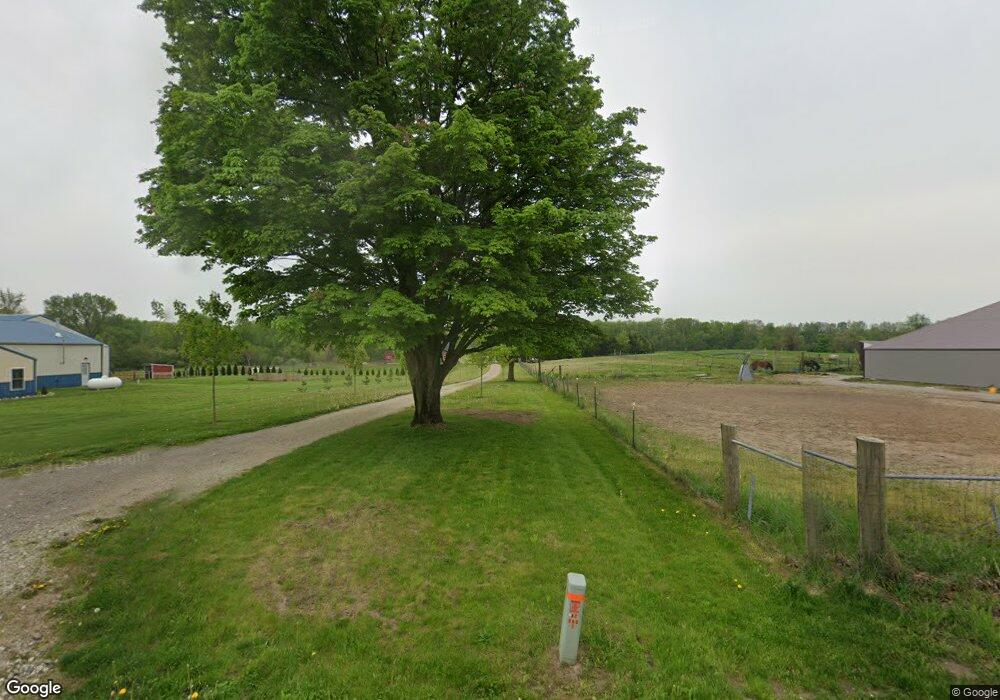
This home is located at 230 W 200 N, Lagrange, IN 46761 and is currently estimated at $404,185, approximately $168 per square foot. 230 W 200 N is a home located in LaGrange County with nearby schools including Lakeland Jr/Sr High School, Creekside Amish School, and Woodside School.
Ownership History
Date
Name
Owned For
Owner Type
Purchase Details
Closed on
May 13, 2021
Sold by
Timeless Ventures Llc
Bought by
Hill Robert L
Current Estimated Value
Home Financials for this Owner
Home Financials are based on the most recent Mortgage that was taken out on this home.
Interest Rate
2.94%
Purchase Details
Closed on
Dec 9, 2019
Sold by
Tri-County Land Trustee Corp
Bought by
Miller Thomas Wallace
Purchase Details
Closed on
Apr 9, 2018
Sold by
Miller Wallace T
Bought by
Tri & County Land Trustee Corp
Create a Home Valuation Report for This Property
The Home Valuation Report is an in-depth analysis detailing your home's value as well as a comparison with similar homes in the area
Purchase History
| Date | Buyer | Sale Price | Title Company |
|---|---|---|---|
| Hill Robert L | $195,000 | -- | |
| Miller Thomas Wallace | $364,216 | Attorney Only | |
| Tri & County Land Trustee Corp | -- | Attorney Only |
Source: Public Records
Mortgage History
| Date | Status | Borrower | Loan Amount |
|---|---|---|---|
| Closed | Hill Robert L | -- |
Source: Public Records
Tax History
| Year | Tax Paid | Tax Assessment Tax Assessment Total Assessment is a certain percentage of the fair market value that is determined by local assessors to be the total taxable value of land and additions on the property. | Land | Improvement |
|---|---|---|---|---|
| 2025 | $1,371 | $319,200 | $36,800 | $282,400 |
| 2024 | $1,371 | $300,100 | $37,200 | $262,900 |
| 2023 | $1,301 | $297,600 | $36,000 | $261,600 |
| 2022 | $1,415 | $230,600 | $31,000 | $199,600 |
| 2021 | $825 | $196,600 | $28,000 | $168,600 |
| 2020 | $1,008 | $192,100 | $28,000 | $164,100 |
| 2019 | $968 | $198,100 | $34,700 | $163,400 |
| 2018 | $2,842 | $415,600 | $43,800 | $371,800 |
| 2017 | $2,222 | $362,700 | $46,300 | $316,400 |
| 2016 | $2,318 | $382,500 | $44,600 | $337,900 |
| 2014 | $1,921 | $315,600 | $45,500 | $270,100 |
| 2013 | $1,921 | $314,700 | $41,700 | $273,000 |
Source: Public Records
Map
Nearby Homes
- 920 N 00ew
- 1575 W 195 N
- 2930 N 080 E
- 737 N Canal St
- 307 N Detroit St
- 602 N Maple St
- 109 E Factory St
- 314 E Michigan St
- 207 S Poplar St
- 202 W Central Ave
- 508 E Spring St
- 217-219 Church St
- 1400 N 200 E
- 2145 W 050 N
- 2325 E 400 N
- 418 Defiance St
- 2200 S State Road 9 Hwy
- 1895 W 570 N
- 00000 E 400 N
- 0000 E 400 N
Your Personal Tour Guide
Ask me questions while you tour the home.