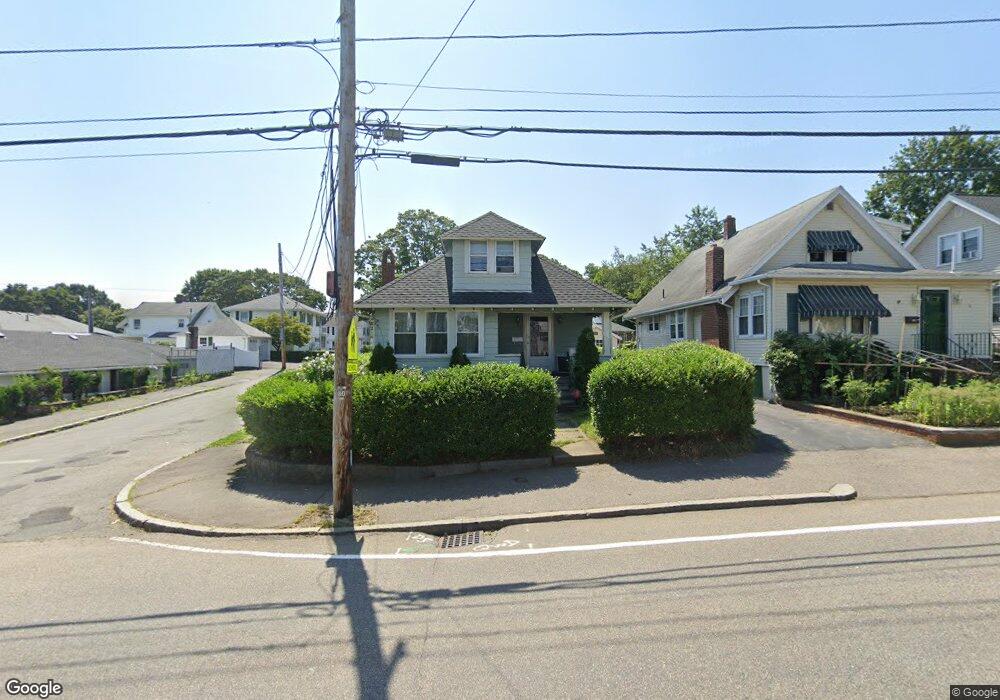
230 W Squantum St Quincy, MA 02171
Montclair NeighborhoodEstimated Value: $695,926 - $817,000
3
Beds
2
Baths
1,552
Sq Ft
$484/Sq Ft
Est. Value
About This Home
This home is located at 230 W Squantum St, Quincy, MA 02171 and is currently estimated at $751,232, approximately $484 per square foot. 230 W Squantum St is a home located in Norfolk County with nearby schools including Montclair Elementary School, Atlantic Middle School, and North Quincy High School.
Ownership History
Date
Name
Owned For
Owner Type
Purchase Details
Closed on
Apr 30, 2003
Sold by
Chan Kevi M and Lee Wai K
Bought by
Luo Hong Y
Current Estimated Value
Home Financials for this Owner
Home Financials are based on the most recent Mortgage that was taken out on this home.
Original Mortgage
$246,400
Interest Rate
5.82%
Mortgage Type
Purchase Money Mortgage
Purchase Details
Closed on
Aug 20, 1997
Sold by
Chan Wilfred Kk and Chan Jane
Bought by
Chan Kwei M
Home Financials for this Owner
Home Financials are based on the most recent Mortgage that was taken out on this home.
Original Mortgage
$80,000
Interest Rate
7.42%
Mortgage Type
Purchase Money Mortgage
Purchase Details
Closed on
Aug 1, 1989
Sold by
Kelley Charles C
Bought by
Chan Jane
Create a Home Valuation Report for This Property
The Home Valuation Report is an in-depth analysis detailing your home's value as well as a comparison with similar homes in the area
Home Values in the Area
Average Home Value in this Area
Purchase History
| Date | Buyer | Sale Price | Title Company |
|---|---|---|---|
| Luo Hong Y | $308,000 | -- | |
| Chan Kwei M | $146,500 | -- | |
| Chan Jane | $164,900 | -- |
Source: Public Records
Mortgage History
| Date | Status | Borrower | Loan Amount |
|---|---|---|---|
| Open | Chan Jane | $228,000 | |
| Closed | Luo Hong Y | $246,400 | |
| Previous Owner | Chan Jane | $80,000 | |
| Previous Owner | Chan Jane | $115,000 |
Source: Public Records
Tax History Compared to Growth
Tax History
| Year | Tax Paid | Tax Assessment Tax Assessment Total Assessment is a certain percentage of the fair market value that is determined by local assessors to be the total taxable value of land and additions on the property. | Land | Improvement |
|---|---|---|---|---|
| 2025 | $6,743 | $584,800 | $331,200 | $253,600 |
| 2024 | $6,326 | $561,300 | $331,200 | $230,100 |
| 2023 | $6,096 | $547,700 | $315,400 | $232,300 |
| 2022 | $6,012 | $501,800 | $274,300 | $227,500 |
| 2021 | $5,771 | $475,400 | $261,300 | $214,100 |
| 2020 | $5,515 | $443,700 | $261,300 | $182,400 |
| 2019 | $5,212 | $415,300 | $244,200 | $171,100 |
| 2018 | $5,125 | $384,200 | $226,100 | $158,100 |
| 2017 | $5,054 | $356,700 | $215,300 | $141,400 |
| 2016 | $4,601 | $320,400 | $187,200 | $133,200 |
| 2015 | $4,238 | $290,300 | $170,200 | $120,100 |
| 2014 | $3,996 | $268,900 | $162,100 | $106,800 |
Source: Public Records
Map
Nearby Homes
- 115 W Squantum St Unit 907
- 115 W Squantum St Unit 810
- 17 Holmes St Unit 2
- 17 Holmes St Unit 4
- 51 Denmark Ave
- 143 Arlington St
- 129-131 Pine St
- 250 Fayette St
- 169 Pine St
- 522 Hancock St
- 85 E Squantum St Unit 10
- 171 Milton St
- 60 Newbury St Unit 10
- 323 Farrington St
- 11 Rockwell Ave
- 121 Hillside Ave
- 11 Earle St
- 55 Christopher Dr
- 45 Marion St
- 91 Atlantic St
- 234 W Squantum St
- 238 W Squantum St
- 167 Holbrook Rd
- 216 W Squantum St
- 220 W Squantum St
- 216-224 W Squantum St
- 161 Holbrook Rd
- 175 Holbrook Rd Unit 2
- 175 Holbrook Rd Unit 1
- 175 Holbrook Rd Unit 4
- 231 W Squantum St
- 231 W Squantum St Unit 1
- 231 W Squantum St Unit B
- 242 W Squantum St
- 157 Holbrook Rd
- 235 W Squantum St
- 181 Holbrook Rd
- 179 Holbrook Rd
- 225 W Squantum St
- 225 W Squantum St Unit 201