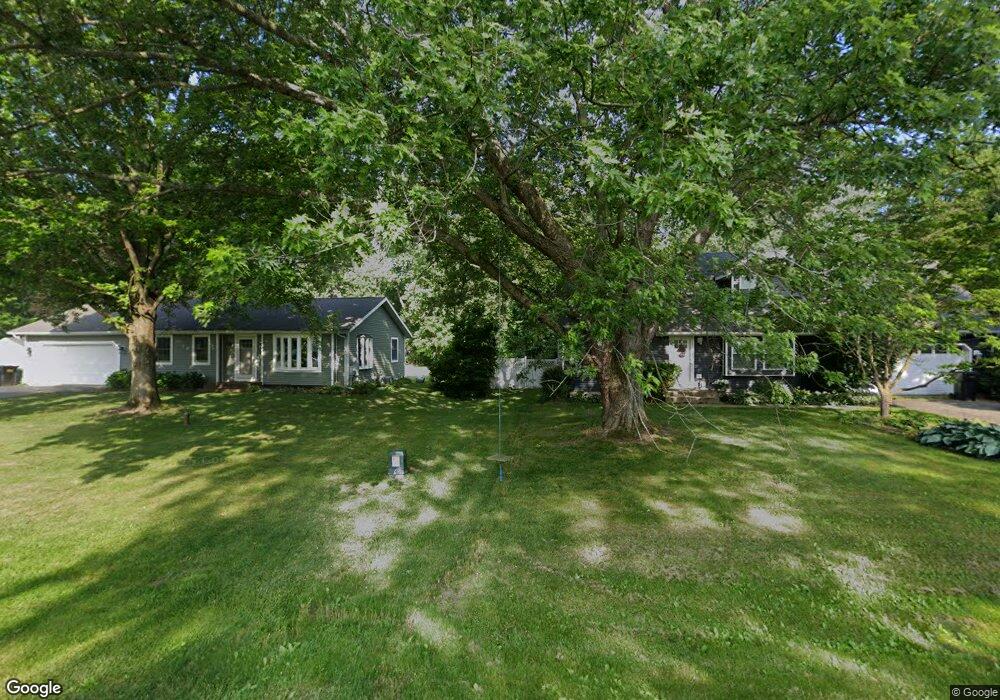
230 W van Bruggen St Plainwell, MI 49080
Estimated Value: $246,000 - $286,000
3
Beds
1
Bath
1,240
Sq Ft
$211/Sq Ft
Est. Value
About This Home
This home is located at 230 W van Bruggen St, Plainwell, MI 49080 and is currently estimated at $262,228, approximately $211 per square foot. 230 W van Bruggen St is a home located in Allegan County with nearby schools including Otsego High School and Otsego Christian Academy.
Ownership History
Date
Name
Owned For
Owner Type
Purchase Details
Closed on
Feb 26, 2018
Sold by
Sparks Elyse M
Bought by
Boyer Kyle Anthony
Current Estimated Value
Home Financials for this Owner
Home Financials are based on the most recent Mortgage that was taken out on this home.
Original Mortgage
$142,323
Outstanding Balance
$120,961
Interest Rate
4.04%
Mortgage Type
New Conventional
Estimated Equity
$141,267
Purchase Details
Closed on
Mar 7, 2013
Sold by
Shipman Henry G
Bought by
Hukill Elyse M
Home Financials for this Owner
Home Financials are based on the most recent Mortgage that was taken out on this home.
Original Mortgage
$113,265
Interest Rate
3.49%
Mortgage Type
New Conventional
Purchase Details
Closed on
Mar 15, 2005
Sold by
Mitchell Cynthia A and Shipman Henry G
Bought by
Shipman Henry G
Home Financials for this Owner
Home Financials are based on the most recent Mortgage that was taken out on this home.
Original Mortgage
$100,000
Interest Rate
5.75%
Mortgage Type
New Conventional
Purchase Details
Closed on
Jun 18, 1998
Sold by
Olrich Dean A and Olrich Kimberly S
Bought by
Mitchell Cynthia
Purchase Details
Closed on
Oct 1, 1988
Sold by
Kathleen Bryer
Bought by
Dean and Kimberly Olrich
Create a Home Valuation Report for This Property
The Home Valuation Report is an in-depth analysis detailing your home's value as well as a comparison with similar homes in the area
Home Values in the Area
Average Home Value in this Area
Purchase History
| Date | Buyer | Sale Price | Title Company |
|---|---|---|---|
| Boyer Kyle Anthony | $140,900 | None Available | |
| Hukill Elyse M | $111,000 | Chicago | |
| Shipman Henry G | -- | Metropolitan Title Company | |
| Mitchell Cynthia | $98,000 | -- | |
| Dean | $54,900 | -- |
Source: Public Records
Mortgage History
| Date | Status | Borrower | Loan Amount |
|---|---|---|---|
| Open | Boyer Kyle Anthony | $142,323 | |
| Previous Owner | Hukill Elyse M | $113,265 | |
| Previous Owner | Shipman Henry G | $100,000 | |
| Previous Owner | Shipman Henry G | $12,000 |
Source: Public Records
Tax History Compared to Growth
Tax History
| Year | Tax Paid | Tax Assessment Tax Assessment Total Assessment is a certain percentage of the fair market value that is determined by local assessors to be the total taxable value of land and additions on the property. | Land | Improvement |
|---|---|---|---|---|
| 2025 | $2,522 | $102,400 | $13,000 | $89,400 |
| 2024 | $2,129 | $97,200 | $10,000 | $87,200 |
| 2023 | $2,167 | $83,100 | $10,000 | $73,100 |
| 2022 | $2,129 | $76,800 | $9,800 | $67,000 |
| 2021 | $2,011 | $70,000 | $6,800 | $63,200 |
| 2020 | $1,986 | $68,300 | $6,800 | $61,500 |
| 2019 | $1,920 | $62,000 | $6,300 | $55,700 |
| 2018 | $1,445 | $62,300 | $6,300 | $56,000 |
| 2017 | $0 | $62,800 | $10,900 | $51,900 |
| 2016 | $0 | $52,500 | $5,100 | $47,400 |
| 2015 | -- | $52,500 | $5,100 | $47,400 |
| 2014 | $1,522 | $44,100 | $5,300 | $38,800 |
| 2013 | $1,522 | $42,700 | $5,800 | $36,900 |
Source: Public Records
Map
Nearby Homes
- 0 12th St Unit VL 24019844
- 355 12th St
- 390 12th St
- 323 13th St
- 551 W Bridge St
- 426 W Bridge St
- 315 W Allegan St
- 909 Barton St
- 1020 Barton St
- 140 W 1st Ave
- 1056 Elmwood St
- 1183 Miller Rd
- 771 N Main St
- V/L 11th St
- 518 Foxmoor Dr Unit 39
- 455 N 10th St
- 623 Glenview Cir
- 317 E Chart St
- 1177 106th Ave
- 1379 106th Ave
- 230 W Vanbruggen Dr
- 226 W van Bruggen St
- 234 W van Bruggen St
- 234 W Vanbruggen Dr
- 311 Caroline Dr
- 222 W van Bruggen St
- 238 W van Bruggen St
- 229 W van Bruggen St
- 233 W van Bruggen St
- 242 W Vanbruggen Dr
- 1253 Timber Oaks Ct
- 225 W van Bruggen St
- 237 W van Bruggen St
- 218 W van Bruggen St
- 242 W van Bruggen St
- 1242 N van Bruggen St
- 1257 Timber Oaks Ct
- 1241 S van Bruggen St
- 1238 N van Bruggen St
- 214 W van Bruggen St