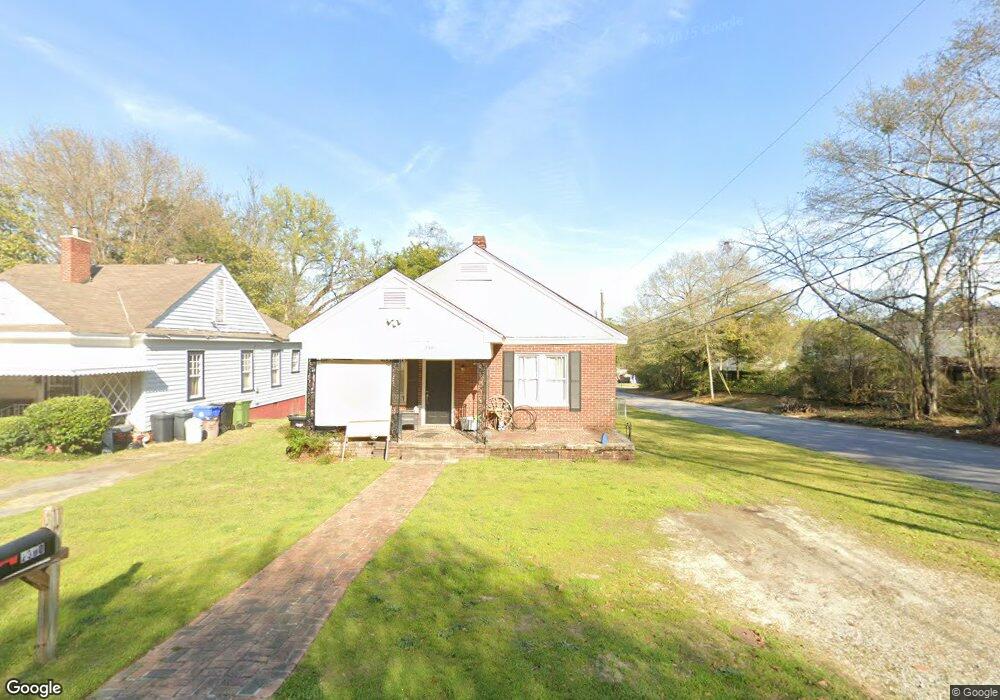
2300 16th Ave Columbus, GA 31901
East Highlands NeighborhoodEstimated Value: $94,000 - $156,000
2
Beds
1
Bath
1,248
Sq Ft
$92/Sq Ft
Est. Value
About This Home
This home is located at 2300 16th Ave, Columbus, GA 31901 and is currently estimated at $114,921, approximately $92 per square foot. 2300 16th Ave is a home located in Muscogee County with nearby schools including Hannan Elementary School, Arnold Middle School, and Jordan Vocational High School.
Ownership History
Date
Name
Owned For
Owner Type
Purchase Details
Closed on
Feb 4, 2022
Sold by
Peter Akkerman Daniel
Bought by
Sfr3-050Llc
Current Estimated Value
Purchase Details
Closed on
Apr 5, 2016
Sold by
Sec Of Veterans Affa
Bought by
J B Carter Real Estate Llc
Purchase Details
Closed on
Dec 1, 2015
Sold by
Jpmorgan Chase Bank Nation
Bought by
Sec Of Veterans Affairs
Create a Home Valuation Report for This Property
The Home Valuation Report is an in-depth analysis detailing your home's value as well as a comparison with similar homes in the area
Home Values in the Area
Average Home Value in this Area
Purchase History
| Date | Buyer | Sale Price | Title Company |
|---|---|---|---|
| Sfr3-050Llc | -- | None Listed On Document | |
| Akkerman Daniel Peter | -- | None Listed On Document | |
| J B Carter Real Estate Llc | $37,000 | -- | |
| Sec Of Veterans Affairs | $51,664 | -- | |
| Jpmorgan Chase Bank National A | $51,664 | -- |
Source: Public Records
Tax History Compared to Growth
Tax History
| Year | Tax Paid | Tax Assessment Tax Assessment Total Assessment is a certain percentage of the fair market value that is determined by local assessors to be the total taxable value of land and additions on the property. | Land | Improvement |
|---|---|---|---|---|
| 2025 | $1,568 | $40,052 | $7,792 | $32,260 |
| 2024 | $1,568 | $40,052 | $7,792 | $32,260 |
| 2023 | $1,087 | $27,600 | $5,080 | $22,520 |
| 2022 | $1,065 | $35,528 | $7,792 | $27,736 |
| 2021 | $1,065 | $26,092 | $7,792 | $18,300 |
| 2020 | $970 | $23,756 | $7,792 | $15,964 |
| 2019 | $973 | $23,756 | $7,792 | $15,964 |
| 2018 | $606 | $35,100 | $7,792 | $27,308 |
| 2017 | $608 | $14,800 | $3,200 | $11,600 |
| 2016 | $1,332 | $27,443 | $8,400 | $19,043 |
| 2015 | $568 | $32,287 | $8,400 | $23,887 |
| 2014 | $570 | $32,287 | $8,400 | $23,887 |
| 2013 | -- | $32,287 | $8,400 | $23,887 |
Source: Public Records
Map
Nearby Homes
- 2302 16th Ave
- 2308 16th Ave
- 2303 17th Ave Unit A
- 2303 17th Ave Unit C
- 2303 17th Ave Unit B
- 2303 17th Ave
- 2314 16th Ave
- 2305 17th Ave
- 1600 23rd St
- 2301 16th Ave
- 2305 16th Ave
- 1528 23rd St
- 2315 17th Ave
- 2307 16th Ave
- 2316 16th Ave
- 2309 16th Ave
- 2311 16th Ave
- 1524 23rd St
- 2319 17th Ave Unit A
- 2319 17th Ave Unit B