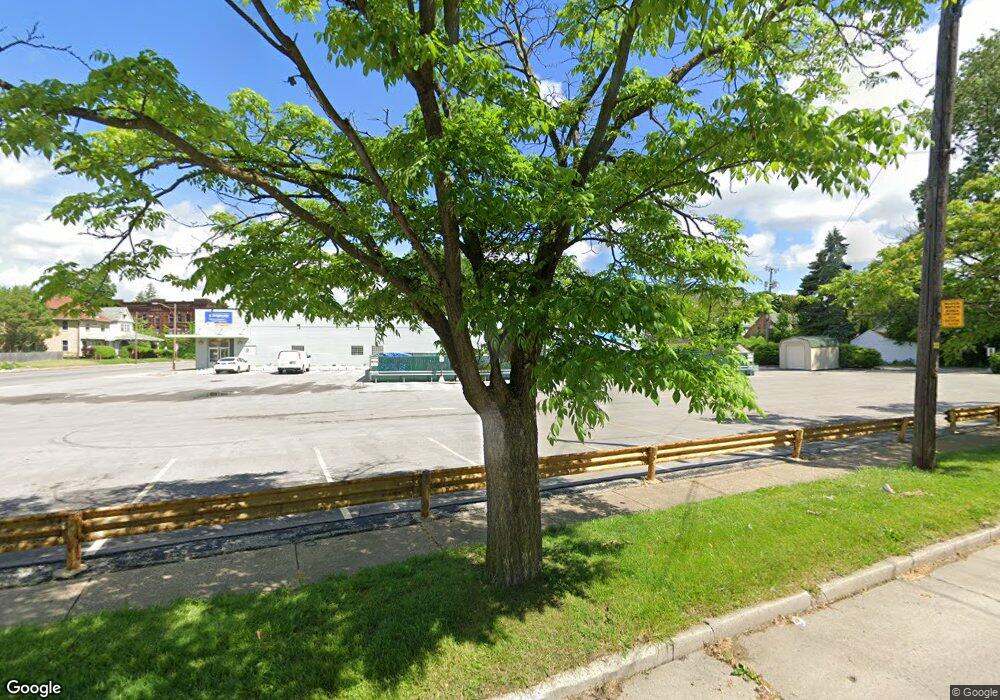
2300 Lagrange St Toledo, OH 43608
Lagrange Neighborhood
Studio
--
Bath
13,020
Sq Ft
47,045
Sq Ft Lot
About This Home
This home is located at 2300 Lagrange St, Toledo, OH 43608. 2300 Lagrange St is a home located in Lucas County with nearby schools including Sherman Elementary School, Woodward High School, and Rosary Cathedral School.
Ownership History
Date
Name
Owned For
Owner Type
Purchase Details
Closed on
Mar 7, 2023
Sold by
Jordan Michael Tersigni Llc
Bought by
Quattro Sorrelle Lagrange Llc
Purchase Details
Closed on
Jun 12, 2015
Sold by
Bright Side Valencia Lagrange Llc
Bought by
Jordan Michael Tersigni Llc
Purchase Details
Closed on
Feb 2, 2007
Sold by
Shikwana Properties Llc and Shikwana Raid
Bought by
Brightside Valencia Lagrange Llc
Purchase Details
Closed on
Oct 29, 2004
Sold by
Modern Enterprises Inc
Bought by
Shikwana Properties Llc
Purchase Details
Closed on
Jul 2, 1996
Sold by
Est Isadore Schall
Bought by
Modern Enterprises Inc
Purchase Details
Closed on
Dec 29, 1987
Create a Home Valuation Report for This Property
The Home Valuation Report is an in-depth analysis detailing your home's value as well as a comparison with similar homes in the area
Home Values in the Area
Average Home Value in this Area
Purchase History
| Date | Buyer | Sale Price | Title Company |
|---|---|---|---|
| Quattro Sorrelle Lagrange Llc | -- | None Listed On Document | |
| Jordan Michael Tersigni Llc | $462,000 | None Available | |
| Brightside Valencia Lagrange Llc | $240,000 | Attorney | |
| Shikwana Properties Llc | $295,000 | -- | |
| Modern Enterprises Inc | $260,000 | -- | |
| -- | $225,000 | -- |
Source: Public Records
Tax History
| Year | Tax Paid | Tax Assessment Tax Assessment Total Assessment is a certain percentage of the fair market value that is determined by local assessors to be the total taxable value of land and additions on the property. | Land | Improvement |
|---|---|---|---|---|
| 2025 | -- | $168,665 | $10,605 | $158,060 |
| 2024 | $7,929 | $168,665 | $10,605 | $158,060 |
| 2023 | $13,471 | $129,535 | $31,640 | $97,895 |
| 2022 | $13,335 | $129,535 | $31,640 | $97,895 |
| 2021 | $13,613 | $129,535 | $31,640 | $97,895 |
| 2020 | $11,071 | $97,125 | $30,240 | $66,885 |
| 2019 | $11,011 | $97,125 | $30,240 | $66,885 |
| 2018 | $10,874 | $97,125 | $30,240 | $66,885 |
| 2017 | $11,072 | $97,125 | $30,240 | $66,885 |
| 2016 | $11,021 | $277,500 | $86,400 | $191,100 |
| 2015 | $10,913 | $277,500 | $86,400 | $191,100 |
| 2014 | $8,635 | $97,130 | $30,240 | $66,890 |
| 2013 | $8,635 | $97,130 | $30,240 | $66,890 |
Source: Public Records
Map
Nearby Homes
- 328 Palmer St
- 333 Palmer St
- 414 Palmer St
- 2619 Locust St
- 1106 Page St
- 2743 Elm St
- 313 Mettler St
- 543 Austin St
- 1721 Walnut St
- 161 Mettler St
- 427 Everett St
- 322 Dexter St
- 1307 Noble St
- 2824 Chestnut St
- 2459 Franklin Ave
- 5 Birckhead Place
- 235 Bronson Ave
- 332 Kosciusko St
- 2919 Chestnut St
- 1418 Yates St
Your Personal Tour Guide
Ask me questions while you tour the home.