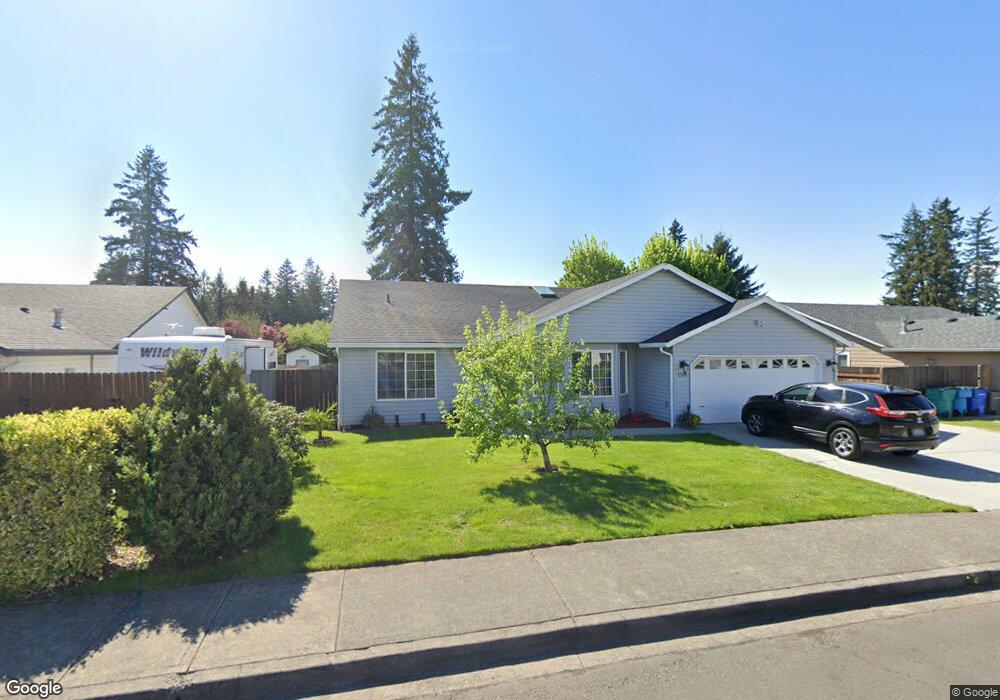
2300 NW 8th Ave Battle Ground, WA 98604
Estimated Value: $526,000 - $584,000
3
Beds
2
Baths
1,856
Sq Ft
$294/Sq Ft
Est. Value
About This Home
This home is located at 2300 NW 8th Ave, Battle Ground, WA 98604 and is currently estimated at $545,527, approximately $293 per square foot. 2300 NW 8th Ave is a home located in Clark County with nearby schools including Captain Strong Primary School, Chief Umtuch Middle School, and Battle Ground High School.
Ownership History
Date
Name
Owned For
Owner Type
Purchase Details
Closed on
Sep 27, 2011
Sold by
Wells Fargo Bank Na
Bought by
Peshkova Tatyana
Current Estimated Value
Purchase Details
Closed on
May 6, 2011
Sold by
Arney Julie R
Bought by
Wells Fargo Bank Na
Purchase Details
Closed on
Sep 27, 2000
Sold by
French Deni L and French Allison H
Bought by
Arney Julie R
Home Financials for this Owner
Home Financials are based on the most recent Mortgage that was taken out on this home.
Original Mortgage
$150,000
Interest Rate
7.98%
Mortgage Type
Stand Alone First
Purchase Details
Closed on
Jun 23, 1999
Sold by
Seppala Homes Inc
Bought by
French Deni L and French Allison
Home Financials for this Owner
Home Financials are based on the most recent Mortgage that was taken out on this home.
Original Mortgage
$130,800
Interest Rate
9.99%
Purchase Details
Closed on
Jan 6, 1998
Sold by
Brousseau Fred and Brosseau Twila Dawn
Bought by
Seppala Homes Inc
Create a Home Valuation Report for This Property
The Home Valuation Report is an in-depth analysis detailing your home's value as well as a comparison with similar homes in the area
Home Values in the Area
Average Home Value in this Area
Purchase History
| Date | Buyer | Sale Price | Title Company |
|---|---|---|---|
| Peshkova Tatyana | $181,000 | First American Title | |
| Wells Fargo Bank Na | $180,937 | None Available | |
| Arney Julie R | $150,000 | Chicago Title Insurance | |
| French Deni L | $145,350 | Clark County Title Company | |
| Seppala Homes Inc | -- | Clark County Title Company |
Source: Public Records
Mortgage History
| Date | Status | Borrower | Loan Amount |
|---|---|---|---|
| Previous Owner | Arney Julie R | $150,000 | |
| Previous Owner | French Deni L | $130,800 |
Source: Public Records
Tax History Compared to Growth
Tax History
| Year | Tax Paid | Tax Assessment Tax Assessment Total Assessment is a certain percentage of the fair market value that is determined by local assessors to be the total taxable value of land and additions on the property. | Land | Improvement |
|---|---|---|---|---|
| 2025 | $3,748 | $457,505 | $155,000 | $302,505 |
| 2024 | $3,357 | $459,684 | $155,000 | $304,684 |
| 2023 | $3,487 | $468,295 | $155,000 | $313,295 |
| 2022 | $3,475 | $443,587 | $123,250 | $320,337 |
| 2021 | $3,411 | $384,168 | $106,250 | $277,918 |
| 2020 | $2,897 | $345,823 | $97,750 | $248,073 |
| 2019 | $2,407 | $332,762 | $100,300 | $232,462 |
| 2018 | $2,923 | $323,547 | $0 | $0 |
| 2017 | $2,471 | $288,738 | $0 | $0 |
| 2016 | $2,434 | $265,785 | $0 | $0 |
| 2015 | $2,377 | $240,204 | $0 | $0 |
| 2014 | -- | $222,589 | $0 | $0 |
| 2013 | -- | $200,124 | $0 | $0 |
Source: Public Records
Map
Nearby Homes
- 706 NW 23rd St
- 617 NW 21st St
- 1904 NW 21st Cir
- 1908 NW 21st Cir
- 2661 NW 9th Place
- 2804 NW 8th Ave
- 2812 NW 8th Ave
- 2820 NW 8th Ave
- 2801 NW 8th Ave
- 2828 NW 8th Ave
- 742 NW 28th St
- 2809 NW 8th Ave
- 734 NW 28th St
- 771 NW 29th St
- 650 NW 28th St
- 755 NW 29th St
- 642 NW 28th St
- 2916 NW 8th Ave
- 634 NW 28th St
- 669 NW 29th St
- 2216 NW 8th Ave
- 2310 NW 8th Ave
- 2316 NW 8th Ave
- 810 NW 22nd St
- 721 NW 23rd St
- 806 NW 22nd St
- 720 NW 23rd St
- 818 NW 22nd St
- 809 NW 24th St
- 2608 NW 22 St
- 719 NW 23rd St
- 718 NW 23rd St
- 720 NW 22nd St
- 721 NW 24th St
- 820 NW 22nd St
- 2400 NW 9th Ave
- 718 NW 22nd St
- 2117 NW 9th Ave
- 713 NW 23rd St
- 712 NW 23rd St