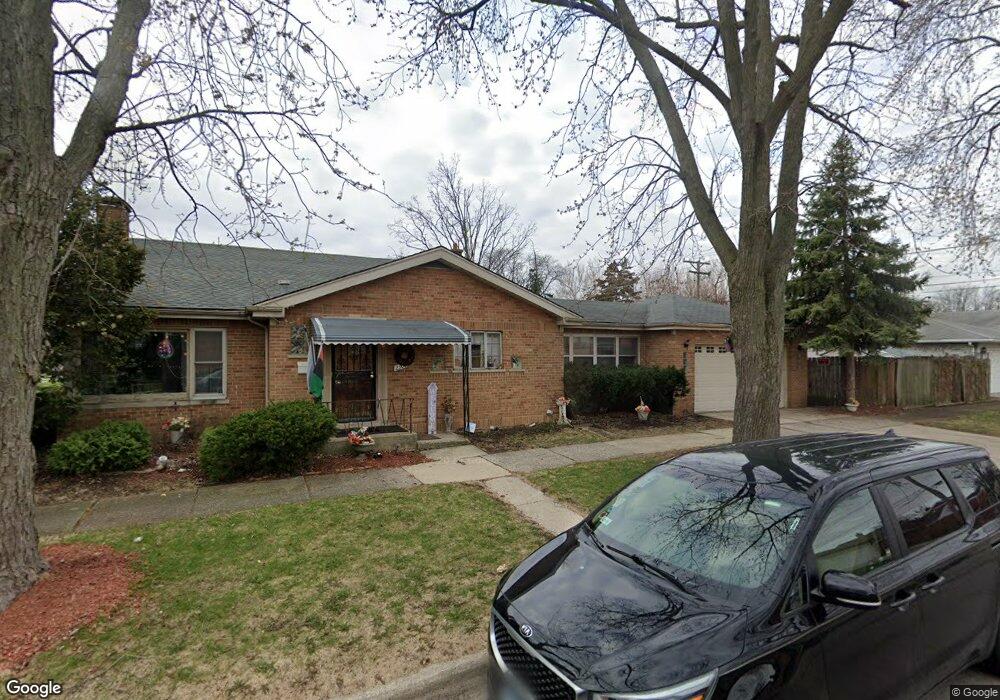
2300 S 23rd Ave Broadview, IL 60155
Estimated Value: $296,000 - $354,000
4
Beds
2
Baths
1,529
Sq Ft
$207/Sq Ft
Est. Value
About This Home
This home is located at 2300 S 23rd Ave, Broadview, IL 60155 and is currently estimated at $316,636, approximately $207 per square foot. 2300 S 23rd Ave is a home located in Cook County with nearby schools including Lindop Elementary School and Proviso East High School.
Ownership History
Date
Name
Owned For
Owner Type
Purchase Details
Closed on
May 3, 2006
Sold by
Cox Steve L and Cox Tamara
Bought by
Vaughn Johnny D
Current Estimated Value
Home Financials for this Owner
Home Financials are based on the most recent Mortgage that was taken out on this home.
Original Mortgage
$190,400
Outstanding Balance
$127,050
Interest Rate
9.23%
Mortgage Type
Fannie Mae Freddie Mac
Estimated Equity
$189,586
Purchase Details
Closed on
Jun 2, 2000
Sold by
Cox Steve L and Cox Lucile
Bought by
Cox Steve L and Cox Tamara
Home Financials for this Owner
Home Financials are based on the most recent Mortgage that was taken out on this home.
Original Mortgage
$131,750
Interest Rate
11.62%
Purchase Details
Closed on
Feb 8, 1996
Sold by
Smith John P and Smith Gail
Bought by
Cox Steve L and Cox Lucille
Home Financials for this Owner
Home Financials are based on the most recent Mortgage that was taken out on this home.
Original Mortgage
$123,700
Interest Rate
7.46%
Mortgage Type
FHA
Create a Home Valuation Report for This Property
The Home Valuation Report is an in-depth analysis detailing your home's value as well as a comparison with similar homes in the area
Home Values in the Area
Average Home Value in this Area
Purchase History
| Date | Buyer | Sale Price | Title Company |
|---|---|---|---|
| Vaughn Johnny D | $238,000 | First American Title | |
| Cox Steve L | -- | -- | |
| Cox Steve L | $133,500 | -- |
Source: Public Records
Mortgage History
| Date | Status | Borrower | Loan Amount |
|---|---|---|---|
| Open | Vaughn Johnny D | $190,400 | |
| Previous Owner | Cox Steve L | $131,750 | |
| Previous Owner | Cox Steve L | $123,700 |
Source: Public Records
Tax History Compared to Growth
Tax History
| Year | Tax Paid | Tax Assessment Tax Assessment Total Assessment is a certain percentage of the fair market value that is determined by local assessors to be the total taxable value of land and additions on the property. | Land | Improvement |
|---|---|---|---|---|
| 2024 | $5,816 | $25,000 | $3,685 | $21,315 |
| 2023 | $4,659 | $25,000 | $3,685 | $21,315 |
| 2022 | $4,659 | $19,101 | $2,680 | $16,421 |
| 2021 | $5,989 | $20,252 | $2,680 | $17,572 |
| 2020 | $6,531 | $20,252 | $2,680 | $17,572 |
| 2019 | $5,595 | $16,624 | $2,512 | $14,112 |
| 2018 | $5,305 | $16,624 | $2,512 | $14,112 |
| 2017 | $5,256 | $16,624 | $2,512 | $14,112 |
| 2016 | $3,662 | $11,565 | $2,345 | $9,220 |
| 2015 | $3,548 | $11,565 | $2,345 | $9,220 |
| 2014 | $4,163 | $13,140 | $2,345 | $10,795 |
| 2013 | $4,362 | $14,531 | $2,345 | $12,186 |
Source: Public Records
Map
Nearby Homes
- 2204 W 14th St
- 2237 S 22nd Ave
- 2440 S 20th Ave
- 2412 S 19th Ave
- 2234 S 18th Ave
- 2011 S 25th Ave
- 2235 S 18th Ave
- 2003 S 24th Ave
- 1113 Bristol Ave
- 1934 S 20th Ave
- 1500 Bristol Ave
- 2510 S 17th Ave
- 1910 S 22nd Ave
- 1910 S 24th Ave
- 1911 S 22nd Ave
- 1926 S 19th Ave
- 917 Bristol Ave
- 2003 S 18th Ave
- 1835 S 24th Ave
- 1909 S 20th Ave
- 2304 S 23rd Ave
- 2308 S 23rd Ave
- 2252 S 23rd Ave
- 2301 S 24th Ave
- 2305 S 24th Ave
- 2312 S 23rd Ave
- 2248 S 23rd Ave
- 2309 S 24th Ave
- 2251 S 24th Ave
- 2301 S 23rd Ave
- 2244 S 23rd Ave
- 2316 S 23rd Ave
- 2313 S 24th Ave
- 2305 S 23rd Ave
- 2249 S 24th Ave
- 2309 S 23rd Ave
- 2253 S 23rd Ave
- 2247 S 24th Ave
- 2317 S 24th Ave