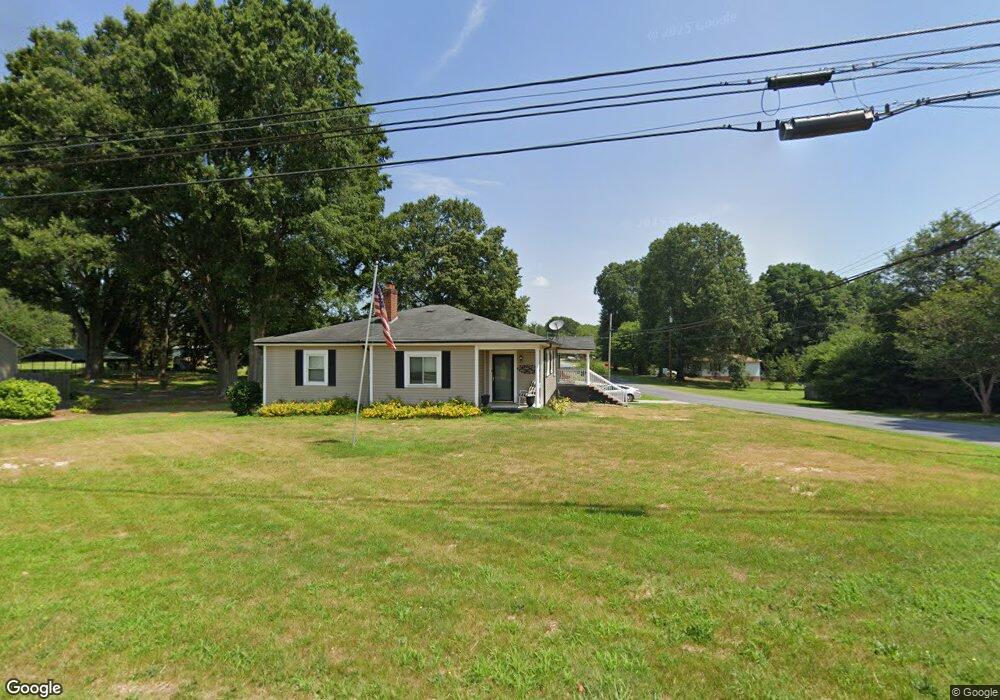
2300 W C St Kannapolis, NC 28081
Estimated Value: $254,362 - $314,000
--
Bed
1
Bath
1,864
Sq Ft
$156/Sq Ft
Est. Value
About This Home
This home is located at 2300 W C St, Kannapolis, NC 28081 and is currently estimated at $290,591, approximately $155 per square foot. 2300 W C St is a home located in Rowan County with nearby schools including Landis Elementary School, Corriher Lipe Middle School, and South Rowan High School.
Ownership History
Date
Name
Owned For
Owner Type
Purchase Details
Closed on
Feb 20, 2023
Sold by
Harrington Eric Ray
Bought by
Harrington Charles W and Harrington Gail B
Current Estimated Value
Purchase Details
Closed on
Mar 11, 2022
Sold by
Harrington Sr Charles W and Harrington Gail B
Bought by
Harrington Charles W and Harrington Gail B
Purchase Details
Closed on
Aug 21, 1996
Bought by
Harrington Charles W and Harrington F
Create a Home Valuation Report for This Property
The Home Valuation Report is an in-depth analysis detailing your home's value as well as a comparison with similar homes in the area
Home Values in the Area
Average Home Value in this Area
Purchase History
| Date | Buyer | Sale Price | Title Company |
|---|---|---|---|
| Harrington Charles W | -- | None Listed On Document | |
| Harrington Charles W | -- | Smith Reginald K | |
| Harrington Charles W | $50,000 | -- |
Source: Public Records
Tax History Compared to Growth
Tax History
| Year | Tax Paid | Tax Assessment Tax Assessment Total Assessment is a certain percentage of the fair market value that is determined by local assessors to be the total taxable value of land and additions on the property. | Land | Improvement |
|---|---|---|---|---|
| 2025 | $1,495 | $226,526 | $35,640 | $190,886 |
| 2024 | $1,495 | $226,526 | $35,640 | $190,886 |
| 2023 | $1,495 | $226,526 | $35,640 | $190,886 |
| 2022 | $1,046 | $141,773 | $24,235 | $117,538 |
| 2021 | $1,046 | $141,773 | $24,235 | $117,538 |
| 2020 | $1,046 | $141,773 | $24,235 | $117,538 |
| 2019 | $1,046 | $141,773 | $24,235 | $117,538 |
| 2018 | $875 | $119,589 | $24,199 | $95,390 |
| 2017 | $875 | $119,589 | $24,199 | $95,390 |
| 2016 | $863 | $119,589 | $24,199 | $95,390 |
| 2015 | $877 | $119,589 | $24,199 | $95,390 |
| 2014 | $673 | $93,513 | $20,166 | $73,347 |
Source: Public Records
Map
Nearby Homes
- 116 Overcash Ave
- 0 Winona Ave
- Lot 1 Arlene Ave
- 0 Enochville Ave Unit CAR4275012
- 117 S Enochville Ave
- 2218 Woodcrest Dr
- 2603 Mcgill St
- 304 Tanglewood Dr
- 115 Northcrest Dr
- 113 Hilton Ave
- 1711 W C St
- 1734 Shadowbrook Dr
- 6621 Charlie Walker Rd
- 0 Smith Rd
- 0000 Buffalo St
- 1530 Buffalo St
- 6124 Avalon Dr
- 122 Andrew St
- 3796 Enochville Rd
- 0 Pump Station Rd