2301 Huldy St Unit B Houston, TX 77019
Montrose NeighborhoodEstimated Value: $499,844 - $637,000
3
Beds
4
Baths
2,370
Sq Ft
$236/Sq Ft
Est. Value
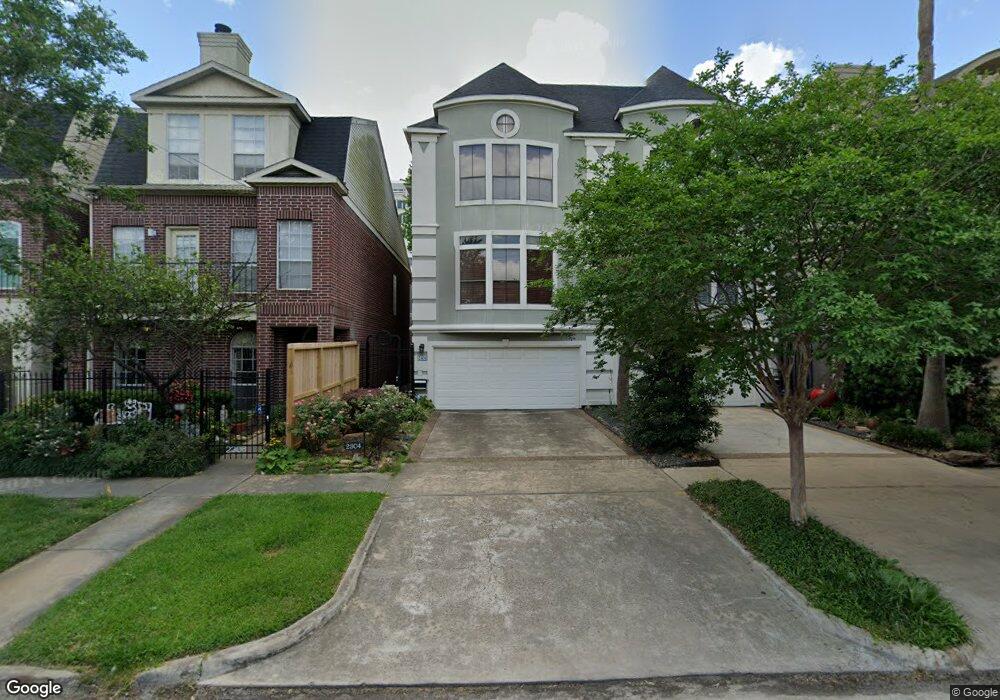
About This Home
This home is located at 2301 Huldy St Unit B, Houston, TX 77019 and is currently estimated at $560,461, approximately $236 per square foot. 2301 Huldy St Unit B is a home located in Harris County with nearby schools including Baker Montessori, Lanier Middle School, and Lamar High School.
Ownership History
Date
Name
Owned For
Owner Type
Purchase Details
Closed on
Dec 4, 2014
Sold by
Johnson Michael and Carberry Kathleen E
Bought by
Podosinnikova Natalia
Current Estimated Value
Purchase Details
Closed on
Dec 15, 2006
Sold by
Feldman Paul B
Bought by
Johnson Michael
Home Financials for this Owner
Home Financials are based on the most recent Mortgage that was taken out on this home.
Original Mortgage
$255,200
Interest Rate
6.3%
Mortgage Type
Purchase Money Mortgage
Purchase Details
Closed on
Mar 31, 1999
Sold by
Al Dajani Khalid A and Al Dajani Patricia A
Bought by
Feldman Paul B
Home Financials for this Owner
Home Financials are based on the most recent Mortgage that was taken out on this home.
Original Mortgage
$238,000
Interest Rate
6.82%
Create a Home Valuation Report for This Property
The Home Valuation Report is an in-depth analysis detailing your home's value as well as a comparison with similar homes in the area
Home Values in the Area
Average Home Value in this Area
Purchase History
| Date | Buyer | Sale Price | Title Company |
|---|---|---|---|
| Podosinnikova Natalia | -- | Charter Title Co | |
| Johnson Michael | -- | Etc | |
| Feldman Paul B | -- | American Title Co |
Source: Public Records
Mortgage History
| Date | Status | Borrower | Loan Amount |
|---|---|---|---|
| Previous Owner | Johnson Michael | $255,200 | |
| Previous Owner | Feldman Paul B | $238,000 |
Source: Public Records
Tax History Compared to Growth
Tax History
| Year | Tax Paid | Tax Assessment Tax Assessment Total Assessment is a certain percentage of the fair market value that is determined by local assessors to be the total taxable value of land and additions on the property. | Land | Improvement |
|---|---|---|---|---|
| 2025 | $6,437 | $454,008 | $169,950 | $284,058 |
| 2024 | $6,437 | $435,649 | $169,950 | $265,699 |
| 2023 | $6,437 | $426,296 | $169,950 | $256,346 |
| 2022 | $8,705 | $395,330 | $169,950 | $225,380 |
| 2021 | $9,479 | $406,706 | $162,225 | $244,481 |
| 2020 | $9,883 | $408,128 | $162,225 | $245,903 |
| 2019 | $10,757 | $425,116 | $111,800 | $313,316 |
| 2018 | $8,609 | $438,000 | $111,800 | $326,200 |
| 2017 | $11,623 | $438,000 | $111,800 | $326,200 |
| 2016 | $11,623 | $438,000 | $111,800 | $326,200 |
| 2015 | $7,256 | $438,000 | $111,800 | $326,200 |
| 2014 | $7,256 | $411,815 | $97,825 | $313,990 |
Source: Public Records
Map
Nearby Homes
- 2315 Huldy St
- 2119 Huldy St
- 2117 Huldy St
- 2115 Huldy St
- 2410 Huldy St
- 2113 Huldy St
- 2112 Mcduffie St
- 2508 Brun St
- 2027 Huldy St
- 2505 Mcduffie St Unit B
- 2103 Hazard St
- 2111 Welch St Unit A321
- 2111 Welch St Unit A232
- 2111 Welch St Unit A107
- 2145 Fairview Ave
- 2309 Driscoll St
- 2221 Driscoll St
- 2026 Welch St
- 2008 Hazard St
- 2313 Kingston St