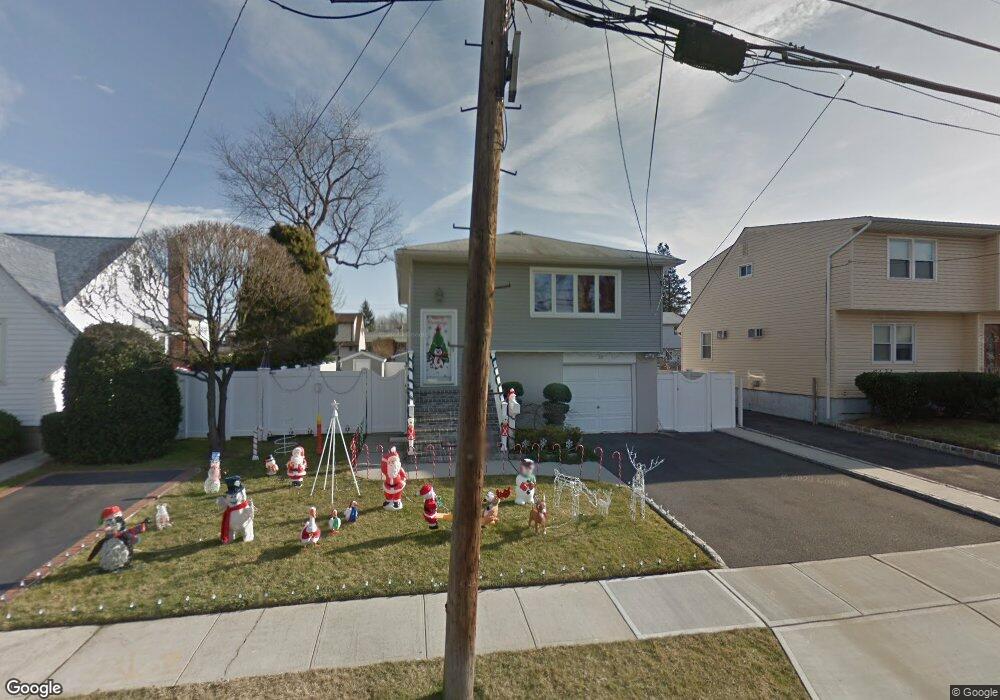
2301 Mattituck Ave Seaford, NY 11783
Estimated Value: $806,123 - $818,000
3
Beds
2
Baths
1,093
Sq Ft
$743/Sq Ft
Est. Value
About This Home
This home is located at 2301 Mattituck Ave, Seaford, NY 11783 and is currently estimated at $812,062, approximately $742 per square foot. 2301 Mattituck Ave is a home located in Nassau County with nearby schools including Seaford Middle School, Seaford Senior High School, and St. William the Abbot School.
Ownership History
Date
Name
Owned For
Owner Type
Purchase Details
Closed on
Sep 27, 2017
Sold by
Grimaldi Joseph E and Grimaldi Christina Farraye
Bought by
Greenberg David and Greenberg Alyson
Current Estimated Value
Home Financials for this Owner
Home Financials are based on the most recent Mortgage that was taken out on this home.
Original Mortgage
$336,500
Outstanding Balance
$281,072
Interest Rate
3.82%
Mortgage Type
New Conventional
Estimated Equity
$530,990
Purchase Details
Closed on
Dec 16, 2005
Sold by
Marsciano Michael
Bought by
Grimaldi Joseph
Purchase Details
Closed on
Jan 31, 2001
Sold by
Si Realty Corp
Bought by
Marsicano Michael
Purchase Details
Closed on
Nov 1, 1999
Sold by
Hamam Sabry and Hamam Katherine Altamore
Bought by
Si Realty 1 Corp
Home Financials for this Owner
Home Financials are based on the most recent Mortgage that was taken out on this home.
Original Mortgage
$170,000
Interest Rate
13.5%
Mortgage Type
Stand Alone First
Create a Home Valuation Report for This Property
The Home Valuation Report is an in-depth analysis detailing your home's value as well as a comparison with similar homes in the area
Home Values in the Area
Average Home Value in this Area
Purchase History
| Date | Buyer | Sale Price | Title Company |
|---|---|---|---|
| Greenberg David | $529,000 | None Available | |
| Grimaldi Joseph | $505,000 | -- | |
| Marsicano Michael | $335,000 | Mitchell Selip | |
| Si Realty 1 Corp | $180,500 | -- |
Source: Public Records
Mortgage History
| Date | Status | Borrower | Loan Amount |
|---|---|---|---|
| Open | Greenberg David | $336,500 | |
| Previous Owner | Si Realty 1 Corp | $170,000 |
Source: Public Records
Tax History Compared to Growth
Tax History
| Year | Tax Paid | Tax Assessment Tax Assessment Total Assessment is a certain percentage of the fair market value that is determined by local assessors to be the total taxable value of land and additions on the property. | Land | Improvement |
|---|---|---|---|---|
| 2025 | $12,784 | $430 | $153 | $277 |
| 2024 | $3,795 | $501 | $178 | $323 |
| 2023 | $13,703 | $500 | $178 | $322 |
| 2022 | $13,703 | $521 | $185 | $336 |
| 2021 | $19,400 | $525 | $186 | $339 |
| 2020 | $14,378 | $741 | $477 | $264 |
| 2019 | $4,760 | $967 | $623 | $344 |
| 2018 | $12,053 | $967 | $0 | $0 |
| 2017 | $8,173 | $858 | $623 | $235 |
| 2016 | $12,073 | $858 | $623 | $235 |
| 2015 | $3,622 | $858 | $623 | $235 |
| 2014 | $3,622 | $858 | $623 | $235 |
| 2013 | $3,397 | $858 | $623 | $235 |
Source: Public Records
Map
Nearby Homes
- 2327 Mattituck Ave
- 2296 Hampton Ave
- 3875 South St
- 2370 Narraganset Ave
- 3937 John Ln
- 3728 E End
- 2437 Archer St
- 3861 Hickory St
- 243 Seaford Ave
- 3608 Tonopah St
- 3945 Hickory St
- 3612 Ladonia St
- 2067 Jackson Ave
- 0 Island Place Unit 3107575
- 3969 Marlow Ct
- 3563 Wadena St
- 3719 Terrapin Place
- 3541 Kenora Place
- 3558 Roanoke St
- 3532 Waverly Ave
- 2297 Mattituck Ave
- 2309 Mattituck Ave
- 2291 Mattituck Ave
- 2306 Penatiquit Ave
- 2300 Penatiquit Ave
- 2312 Penatiquit Ave
- 2285 Mattituck Ave
- 2315 Mattituck Ave
- 2290 Penatiquit Ave
- 2300 Mattituck Ave
- 2304 Mattituck Ave
- 2288 Penatiquit Ave
- 2318 Penatiquit Ave
- 2283 Mattituck Ave
- 2296 Mattituck Ave
- 2316 Mattituck Ave
- 2286 Penatiquit Ave
- 2281 Mattituck Ave
- 3829 Harbor Blvd
- 2286 Mattituck Ave