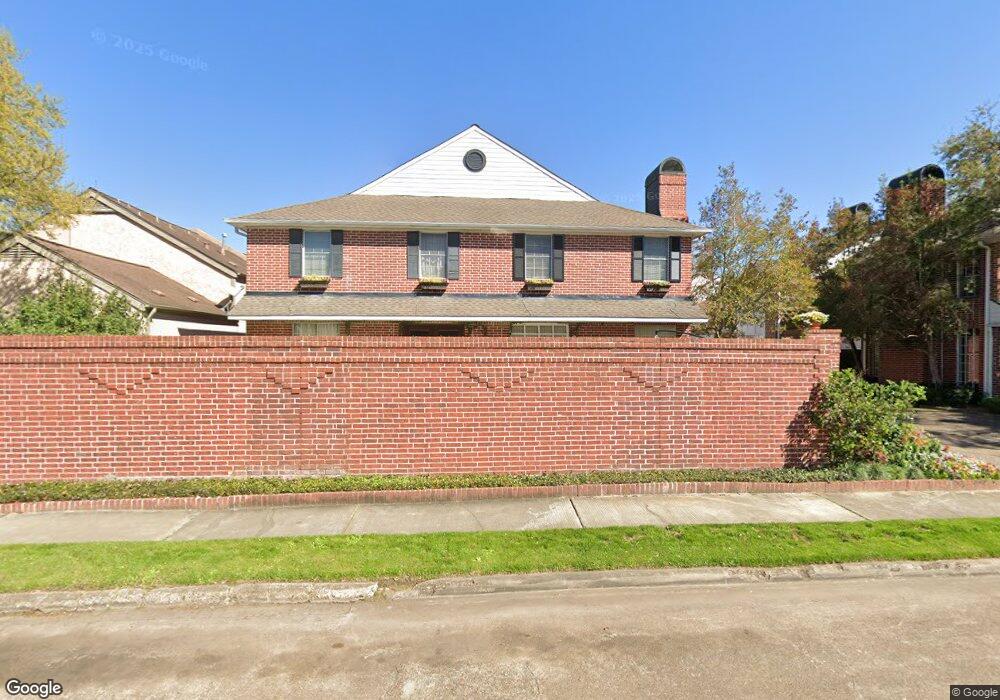
2301 Nantucket Dr Houston, TX 77057
Uptown-Galleria District NeighborhoodEstimated Value: $572,000 - $747,000
3
Beds
3
Baths
2,884
Sq Ft
$222/Sq Ft
Est. Value
About This Home
This home is located at 2301 Nantucket Dr, Houston, TX 77057 and is currently estimated at $640,150, approximately $221 per square foot. 2301 Nantucket Dr is a home located in Harris County with nearby schools including Briargrove Elementary School, Tanglewood Middle, and Wisdom High School.
Ownership History
Date
Name
Owned For
Owner Type
Purchase Details
Closed on
Oct 28, 2004
Sold by
Smith Bruce and Smith Margaret
Bought by
Lucia Denise
Current Estimated Value
Purchase Details
Closed on
Jul 10, 2003
Sold by
Lucia Denise
Bought by
Caldwell Marc T
Purchase Details
Closed on
Feb 10, 2003
Sold by
Caldwell Marc T
Bought by
Lucia Denise
Purchase Details
Closed on
Apr 29, 2002
Sold by
Ludecke Alan and Ludecke Renate
Bought by
Caldwell Marc T
Home Financials for this Owner
Home Financials are based on the most recent Mortgage that was taken out on this home.
Original Mortgage
$304,650
Interest Rate
7.11%
Purchase Details
Closed on
Jul 27, 1994
Sold by
Burke Bradley H and Burke Colleen S
Bought by
Cantrell Anthony C
Home Financials for this Owner
Home Financials are based on the most recent Mortgage that was taken out on this home.
Original Mortgage
$167,200
Interest Rate
7.88%
Create a Home Valuation Report for This Property
The Home Valuation Report is an in-depth analysis detailing your home's value as well as a comparison with similar homes in the area
Home Values in the Area
Average Home Value in this Area
Purchase History
| Date | Buyer | Sale Price | Title Company |
|---|---|---|---|
| Lucia Denise | -- | Charter Title Company | |
| Caldwell Marc T | -- | Charter Title Company | |
| Lucia Denise | -- | -- | |
| Caldwell Marc T | -- | Partners Title Company | |
| Cantrell Anthony C | -- | Title Agency #26 |
Source: Public Records
Mortgage History
| Date | Status | Borrower | Loan Amount |
|---|---|---|---|
| Previous Owner | Caldwell Marc T | $304,650 | |
| Previous Owner | Cantrell Anthony C | $167,200 |
Source: Public Records
Tax History Compared to Growth
Tax History
| Year | Tax Paid | Tax Assessment Tax Assessment Total Assessment is a certain percentage of the fair market value that is determined by local assessors to be the total taxable value of land and additions on the property. | Land | Improvement |
|---|---|---|---|---|
| 2025 | $4,640 | $609,113 | $157,101 | $452,012 |
| 2024 | $4,640 | $567,900 | $157,101 | $410,799 |
| 2023 | $4,640 | $596,877 | $157,101 | $439,776 |
| 2022 | $12,256 | $570,963 | $157,101 | $413,862 |
| 2021 | $11,793 | $506,004 | $157,101 | $348,903 |
| 2020 | $12,370 | $510,806 | $157,101 | $353,705 |
| 2019 | $12,926 | $510,806 | $157,101 | $353,705 |
| 2018 | $9,491 | $481,343 | $157,101 | $324,242 |
| 2017 | $12,171 | $481,343 | $157,101 | $324,242 |
| 2016 | $11,733 | $481,343 | $157,101 | $324,242 |
| 2015 | $7,748 | $472,869 | $157,101 | $315,768 |
| 2014 | $7,748 | $419,178 | $157,101 | $262,077 |
Source: Public Records
Map
Nearby Homes
- 2222 Nantucket Dr Unit B
- 2218 Nantucket Dr
- 2309 Potomac Dr
- 6024 Burgoyne Rd
- 2403 Potomac Dr
- 2422 Nantucket Dr Unit C
- 2421 Potomac Dr Unit C
- 2201 Fountain View Dr Unit 63
- 2201 Fountain View Dr Unit 14J
- 2430 Nantucket Dr Unit B
- 2117 Nantucket Dr
- 2121 Fountain View Dr Unit 6
- 2121 Fountain View Dr Unit 22
- 2113 Potomac Dr Unit D
- 2300 Augusta Dr Unit 22
- 2101 Fountain View Dr Unit 80
- 2101 Fountain View Dr Unit 55
- 2101 Fountain View Dr Unit 76B
- 2101 Fountain View Dr Unit 1
- 5863 Inwood Dr Unit 5
- 2301 Nantucket Dr
- 2301 Nantucket Dr Unit B
- 2301 Nantucket Dr Unit D
- 2301 Nantucket Dr Unit C
- 2305 Nantucket Dr Unit D
- 2305 Nantucket Dr Unit C
- 2305 Nantucket Dr Unit B
- 2305 Nantucket Dr
- 2217 Nantucket Dr Unit B
- 2217 Nantucket Dr Unit C
- 2217 Nantucket Dr
- 2217 Nantucket Dr Unit D
- 2219 Nantucket Dr
- 2219 Nantucket Dr Unit A
- 2219 Nantucket Dr
- 2219 Nantucket Dr Unit B
- 2300 Nantucket Dr
- 2309 Nantucket Dr Unit D
- 2309 Nantucket Dr Unit C
- 2309 Nantucket Dr