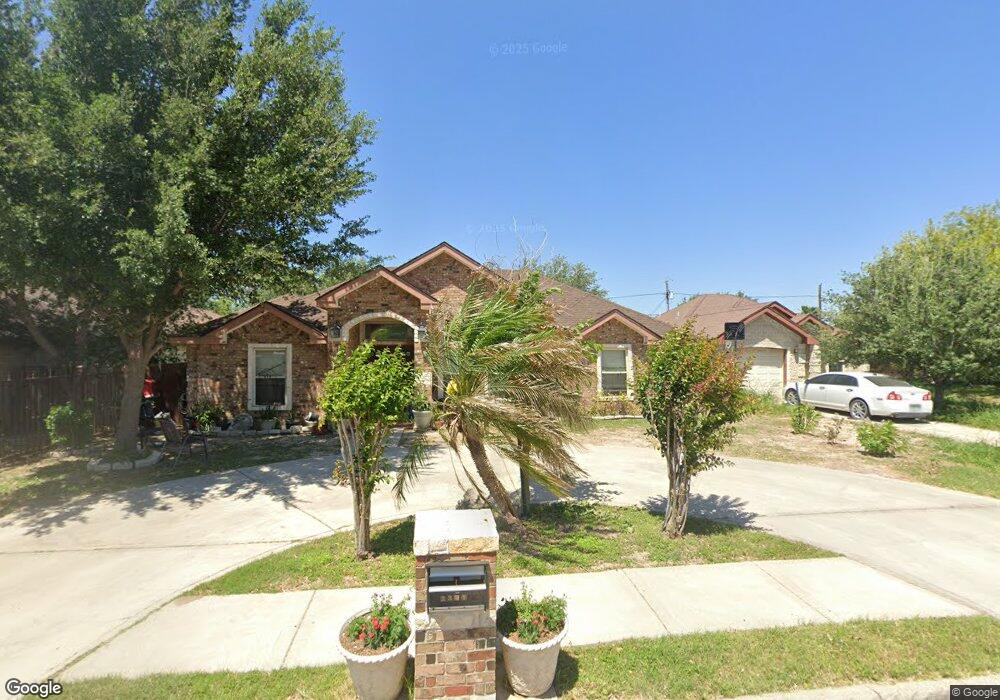
2301 Olmitos Ave San Juan, TX 78589
Estimated Value: $178,892 - $239,000
3
Beds
2
Baths
1,750
Sq Ft
$119/Sq Ft
Est. Value
About This Home
This home is located at 2301 Olmitos Ave, San Juan, TX 78589 and is currently estimated at $207,723, approximately $118 per square foot. 2301 Olmitos Ave is a home located in Hidalgo County with nearby schools including John Doedyns Elementary, Raul H. Yzaguirre Middle School, and PSJA Early College High School.
Ownership History
Date
Name
Owned For
Owner Type
Purchase Details
Closed on
Oct 5, 2011
Sold by
Durango Development Inc
Bought by
Alaniz Daniel Trelidcek
Current Estimated Value
Home Financials for this Owner
Home Financials are based on the most recent Mortgage that was taken out on this home.
Original Mortgage
$59,400
Outstanding Balance
$40,650
Interest Rate
4.17%
Mortgage Type
Seller Take Back
Estimated Equity
$167,073
Purchase Details
Closed on
Oct 20, 2009
Sold by
Carolina Custom Homes Llc
Bought by
Alaniz Juanita Maria
Home Financials for this Owner
Home Financials are based on the most recent Mortgage that was taken out on this home.
Original Mortgage
$111,015
Interest Rate
5.14%
Mortgage Type
FHA
Purchase Details
Closed on
Feb 22, 2008
Sold by
Romo Raul and Romo Nancy Patricia
Bought by
Salinas Ariel
Purchase Details
Closed on
Jan 4, 2006
Sold by
Torre Fuerte Properties L L C
Bought by
Romo Raul and Romo Nancy Patricia
Create a Home Valuation Report for This Property
The Home Valuation Report is an in-depth analysis detailing your home's value as well as a comparison with similar homes in the area
Home Values in the Area
Average Home Value in this Area
Purchase History
| Date | Buyer | Sale Price | Title Company |
|---|---|---|---|
| Alaniz Daniel Trelidcek | -- | None Available | |
| Alaniz Juanita Maria | -- | Vltc | |
| Salinas Ariel | -- | None Available | |
| Romo Raul | -- | Charge Sierra Title |
Source: Public Records
Mortgage History
| Date | Status | Borrower | Loan Amount |
|---|---|---|---|
| Open | Alaniz Daniel Trelidcek | $59,400 | |
| Previous Owner | Alaniz Juanita Maria | $111,015 |
Source: Public Records
Tax History Compared to Growth
Tax History
| Year | Tax Paid | Tax Assessment Tax Assessment Total Assessment is a certain percentage of the fair market value that is determined by local assessors to be the total taxable value of land and additions on the property. | Land | Improvement |
|---|---|---|---|---|
| 2025 | $2,219 | $137,448 | -- | -- |
| 2024 | $2,219 | $124,953 | -- | -- |
| 2023 | $2,941 | $113,594 | $0 | $0 |
| 2022 | $2,854 | $103,267 | $22,302 | $80,965 |
| 2021 | $2,747 | $97,198 | $22,302 | $81,698 |
| 2020 | $2,540 | $88,362 | $22,302 | $66,060 |
| 2019 | $2,634 | $88,362 | $22,302 | $66,060 |
| 2018 | $2,674 | $89,188 | $22,302 | $66,886 |
| 2017 | $2,528 | $83,778 | $15,240 | $68,538 |
| 2016 | $2,541 | $84,202 | $14,496 | $69,706 |
| 2015 | $2,170 | $84,202 | $14,496 | $69,706 |
Source: Public Records
Map
Nearby Homes
- 2100 Doe St
- 605 E Leticia St
- 2011 Buffalo St
- 4011 N Veterans Blvd
- 3705 N Veterans Blvd
- 2023 N Veterans Blvd
- 601 N Veterans Blvd
- 0 N I Rd Unit 449451
- 2505 N Raul Longoria Rd
- 4908 N Raul Longoria Rd
- 3605 N Veterans Blvd
- 305 San Marcos St
- 119 Encino Dr
- 204 Lovely Way Ave
- 3721 N Veterans Blvd
- 203 Encino Dr
- 137 N Deanna Dr
- 210 Lilly Dr
- 209 San Ignacio Ave
- 306 E Eagle St