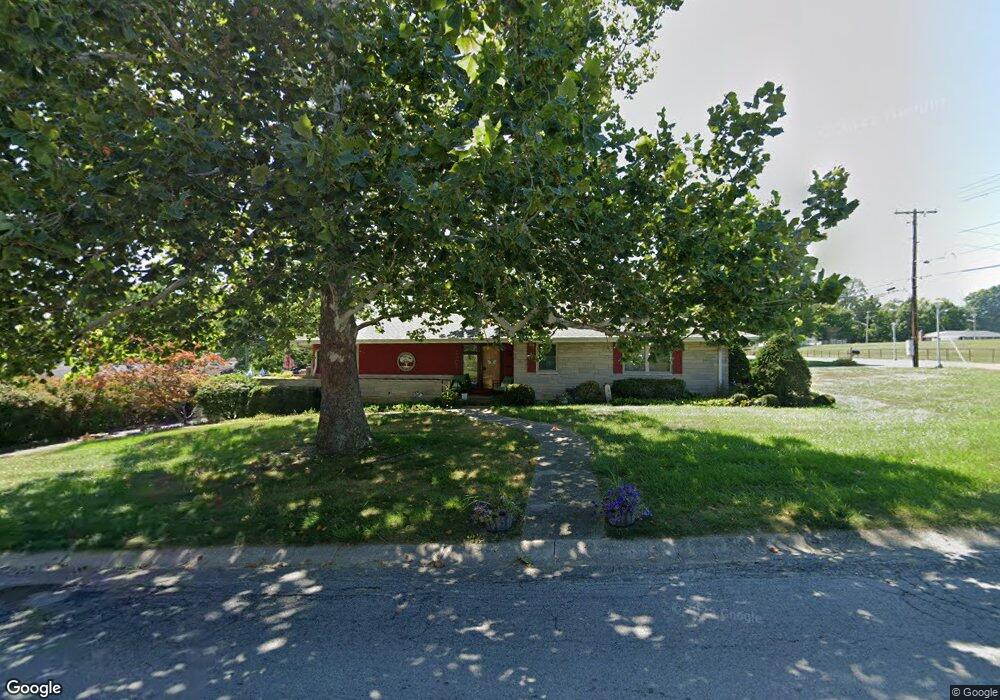
2301 S A St Richmond, IN 47374
Estimated Value: $182,916 - $246,000
3
Beds
2
Baths
1,560
Sq Ft
$133/Sq Ft
Est. Value
About This Home
This home is located at 2301 S A St, Richmond, IN 47374 and is currently estimated at $207,729, approximately $133 per square foot. 2301 S A St is a home located in Wayne County with nearby schools including Charles Elementary School, Julia E. Test Intermediate School, and Richmond High School.
Ownership History
Date
Name
Owned For
Owner Type
Purchase Details
Closed on
Nov 8, 2010
Sold by
Isaacs Rodney M
Bought by
Lehman Penny E and Lehman Penny Isaacs
Current Estimated Value
Purchase Details
Closed on
Dec 15, 2006
Sold by
Plazek Annette Denise
Bought by
Isaacs Rodney M and Isaacs Penny E
Home Financials for this Owner
Home Financials are based on the most recent Mortgage that was taken out on this home.
Original Mortgage
$74,000
Outstanding Balance
$44,366
Interest Rate
6.36%
Mortgage Type
New Conventional
Estimated Equity
$163,363
Create a Home Valuation Report for This Property
The Home Valuation Report is an in-depth analysis detailing your home's value as well as a comparison with similar homes in the area
Home Values in the Area
Average Home Value in this Area
Purchase History
| Date | Buyer | Sale Price | Title Company |
|---|---|---|---|
| Lehman Penny E | -- | -- | |
| Isaacs Rodney M | -- | -- | |
| Isaacs Rodney M | -- | -- |
Source: Public Records
Mortgage History
| Date | Status | Borrower | Loan Amount |
|---|---|---|---|
| Open | Isaacs Rodney M | $74,000 |
Source: Public Records
Tax History Compared to Growth
Tax History
| Year | Tax Paid | Tax Assessment Tax Assessment Total Assessment is a certain percentage of the fair market value that is determined by local assessors to be the total taxable value of land and additions on the property. | Land | Improvement |
|---|---|---|---|---|
| 2024 | $1,476 | $147,600 | $22,100 | $125,500 |
| 2023 | $1,292 | $129,200 | $19,400 | $109,800 |
| 2022 | $1,268 | $126,800 | $19,400 | $107,400 |
| 2021 | $1,181 | $118,100 | $19,400 | $98,700 |
| 2020 | $1,147 | $114,700 | $19,400 | $95,300 |
| 2019 | $1,135 | $113,500 | $19,400 | $94,100 |
| 2018 | $1,099 | $109,900 | $19,400 | $90,500 |
| 2017 | $1,054 | $105,400 | $19,400 | $86,000 |
| 2016 | $1,034 | $103,400 | $19,400 | $84,000 |
| 2014 | $1,073 | $107,300 | $19,400 | $87,900 |
| 2013 | $1,073 | $108,300 | $19,400 | $88,900 |
Source: Public Records
Map
Nearby Homes