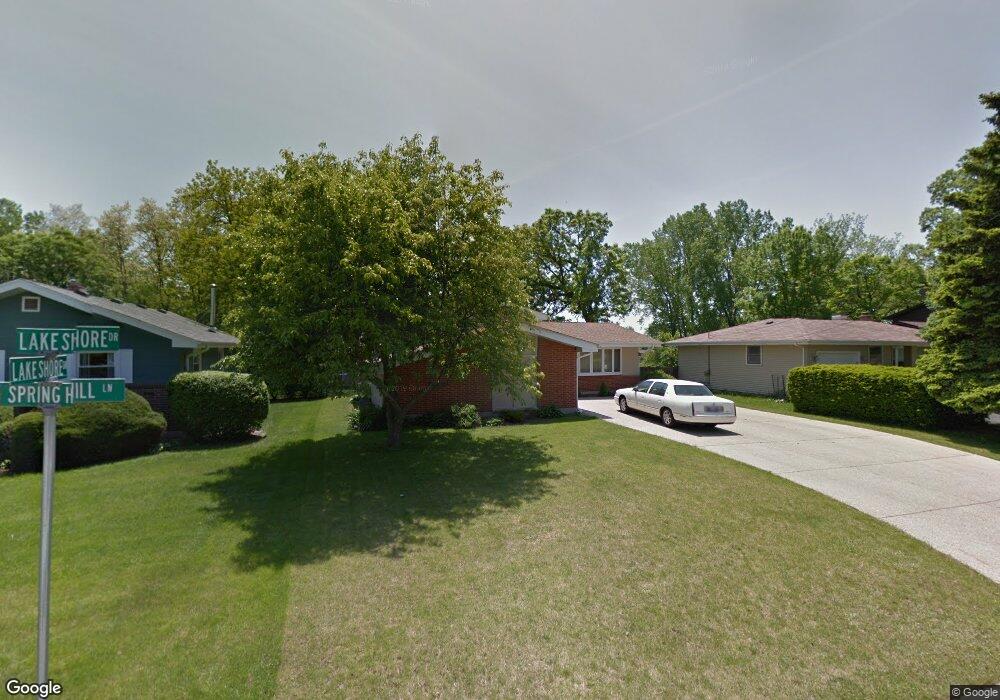
2301 Springhill Ln Lindenhurst, IL 60046
Estimated Value: $304,000 - $383,000
3
Beds
2
Baths
1,105
Sq Ft
$300/Sq Ft
Est. Value
About This Home
This home is located at 2301 Springhill Ln, Lindenhurst, IL 60046 and is currently estimated at $331,173, approximately $299 per square foot. 2301 Springhill Ln is a home located in Lake County with nearby schools including Lakes Community High School.
Ownership History
Date
Name
Owned For
Owner Type
Purchase Details
Closed on
Jun 1, 2005
Sold by
Vandellen Robert L and Vandellen Van Dellen
Bought by
Nelson Christopher R and Nelson Christine S
Current Estimated Value
Home Financials for this Owner
Home Financials are based on the most recent Mortgage that was taken out on this home.
Original Mortgage
$113,000
Outstanding Balance
$58,955
Interest Rate
5.75%
Mortgage Type
Fannie Mae Freddie Mac
Estimated Equity
$272,218
Purchase Details
Closed on
Jun 17, 1998
Sold by
Leise Matthew A and Trust #2301
Bought by
Vandellen Robert L and Vandellen Shelley A
Home Financials for this Owner
Home Financials are based on the most recent Mortgage that was taken out on this home.
Original Mortgage
$110,000
Interest Rate
7.27%
Purchase Details
Closed on
Jan 14, 1997
Sold by
Leise Marla C
Bought by
Leise Matthew A and Trust #2301
Create a Home Valuation Report for This Property
The Home Valuation Report is an in-depth analysis detailing your home's value as well as a comparison with similar homes in the area
Home Values in the Area
Average Home Value in this Area
Purchase History
| Date | Buyer | Sale Price | Title Company |
|---|---|---|---|
| Nelson Christopher R | $225,000 | St | |
| Vandellen Robert L | $130,000 | First American Title | |
| Leise Matthew A | -- | -- |
Source: Public Records
Mortgage History
| Date | Status | Borrower | Loan Amount |
|---|---|---|---|
| Open | Nelson Christopher R | $113,000 | |
| Previous Owner | Vandellen Robert L | $110,000 |
Source: Public Records
Tax History Compared to Growth
Tax History
| Year | Tax Paid | Tax Assessment Tax Assessment Total Assessment is a certain percentage of the fair market value that is determined by local assessors to be the total taxable value of land and additions on the property. | Land | Improvement |
|---|---|---|---|---|
| 2024 | $7,603 | $86,429 | $13,388 | $73,041 |
| 2023 | $7,361 | $76,364 | $11,829 | $64,535 |
| 2022 | $7,361 | $70,466 | $10,973 | $59,493 |
| 2021 | $6,991 | $65,458 | $10,193 | $55,265 |
| 2020 | $6,830 | $63,360 | $9,866 | $53,494 |
| 2019 | $6,995 | $60,894 | $9,482 | $51,412 |
| 2018 | $6,558 | $59,453 | $13,865 | $45,588 |
| 2017 | $6,381 | $57,867 | $13,495 | $44,372 |
| 2016 | $6,506 | $55,524 | $12,949 | $42,575 |
| 2015 | $6,207 | $51,858 | $12,094 | $39,764 |
| 2014 | $5,072 | $46,736 | $12,149 | $34,587 |
| 2012 | $4,725 | $46,963 | $13,844 | $33,119 |
Source: Public Records
Map
Nearby Homes
- 59 Chestnut Cir
- 422 Northgate Rd
- 205 Countryside Ln
- 1900 Burr Oak Ln Unit 15
- 102 Hawthorne Dr
- 527 Northgate Rd Unit 28
- 225 Ironwood Dr
- 2308 E Sand Lake Rd
- 694 Monroe Dr
- 692 Monroe Dr
- 691 N Autumn Cir
- 405 Woodland Trail
- 590 Oxford Ln
- 249 Jasmine Cir
- 345 Kestrel Ln
- 420 Woodland Trail
- 428 Woodland Trail
- 20634 W Siena Dr
- 586 Harvard Ct
- 434 Woodland Trail
- 2303 Springhill Ln
- 2207 Lake Shore Dr Unit 24
- 2305 Springhill Ln
- 2205 Lake Shore Dr
- 2307 Springhill Ln
- 2203 Lake Shore Dr
- 2208 Lake Shore Dr
- 300 Lake Shore Dr
- 2309 Springhill Ln
- 2308 Springhill Ln
- 2206 Lake Shore Dr
- 2320 Kelsey Ct
- 2204 Lake Shore Dr
- 2201 Lake Shore Dr
- 2311 Springhill Ln
- 305 Lake Shore Dr
- 2202 Lake Shore Dr Unit 24
- 302 Lake Shore Dr Unit 26
- 2330 Kelsey Ct
- 2310 Springhill Ln