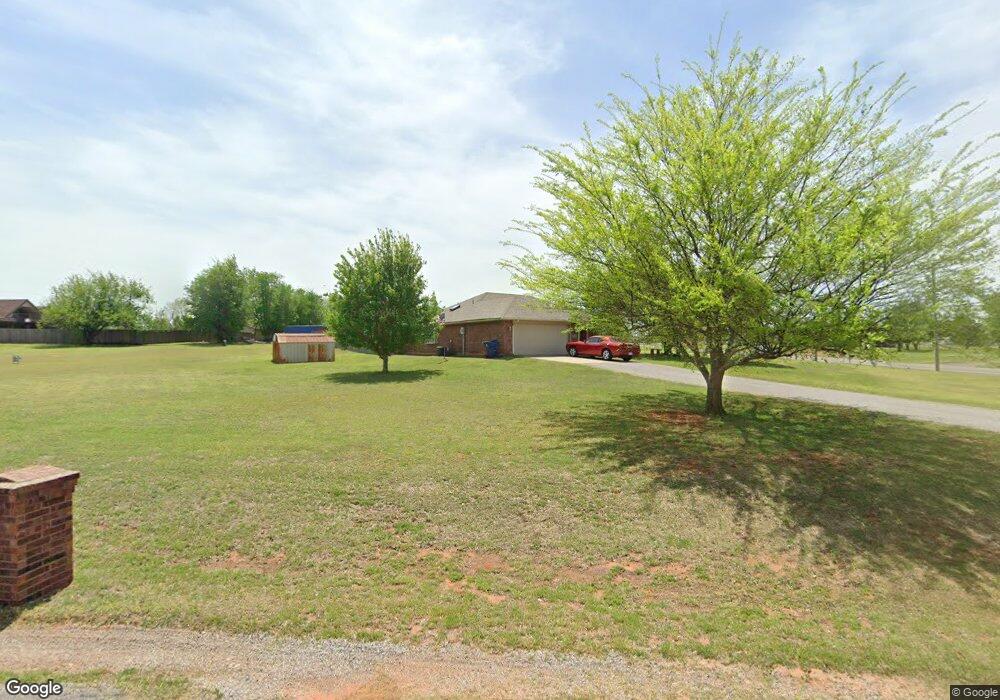
2301 Squirrel Rd Tuttle, OK 73089
Bridge Creek NeighborhoodEstimated Value: $271,000 - $497,002
3
Beds
2
Baths
1,474
Sq Ft
$238/Sq Ft
Est. Value
About This Home
This home is located at 2301 Squirrel Rd, Tuttle, OK 73089 and is currently estimated at $350,751, approximately $237 per square foot. 2301 Squirrel Rd is a home located in Grady County with nearby schools including Bridge Creek Elementary School, Bridge Creek Middle School, and Bridge Creek High School.
Ownership History
Date
Name
Owned For
Owner Type
Purchase Details
Closed on
May 14, 2009
Sold by
Sirva Relocation Credit Llc
Bought by
Babcock Phillip W and Babcock Garnet E
Current Estimated Value
Home Financials for this Owner
Home Financials are based on the most recent Mortgage that was taken out on this home.
Original Mortgage
$124,100
Outstanding Balance
$77,732
Interest Rate
4.77%
Mortgage Type
New Conventional
Estimated Equity
$273,019
Purchase Details
Closed on
Feb 24, 2006
Sold by
Flick Nicole N and Flick Tim
Bought by
Christopher Richard Terry and Christopher Kristin Diane
Home Financials for this Owner
Home Financials are based on the most recent Mortgage that was taken out on this home.
Original Mortgage
$111,900
Interest Rate
6.1%
Mortgage Type
New Conventional
Purchase Details
Closed on
Jun 11, 1996
Sold by
Hames Dick L and Hames Ruby J
Bought by
Williams Nicole N
Create a Home Valuation Report for This Property
The Home Valuation Report is an in-depth analysis detailing your home's value as well as a comparison with similar homes in the area
Home Values in the Area
Average Home Value in this Area
Purchase History
| Date | Buyer | Sale Price | Title Company |
|---|---|---|---|
| Babcock Phillip W | $138,000 | None Available | |
| Sirva Relocation Credit Llc | $138,000 | None Available | |
| Christopher Richard Terry | $140,000 | None Available | |
| Williams Nicole N | $9,500 | -- |
Source: Public Records
Mortgage History
| Date | Status | Borrower | Loan Amount |
|---|---|---|---|
| Open | Babcock Phillip W | $124,100 | |
| Previous Owner | Christopher Richard Terry | $111,900 |
Source: Public Records
Tax History
| Year | Tax Paid | Tax Assessment Tax Assessment Total Assessment is a certain percentage of the fair market value that is determined by local assessors to be the total taxable value of land and additions on the property. | Land | Improvement |
|---|---|---|---|---|
| 2025 | $1,895 | $17,957 | $3,097 | $14,860 |
| 2024 | $1,836 | $17,434 | $3,007 | $14,427 |
| 2023 | $1,836 | $16,926 | $3,078 | $13,848 |
| 2022 | $1,727 | $16,433 | $3,350 | $13,083 |
| 2021 | $1,678 | $15,954 | $3,343 | $12,611 |
| 2020 | $1,643 | $15,490 | $3,214 | $12,276 |
| 2019 | $1,588 | $15,039 | $1,593 | $13,446 |
| 2018 | $1,633 | $15,375 | $1,593 | $13,782 |
| 2017 | $1,562 | $15,309 | $1,593 | $13,716 |
| 2016 | $1,558 | $15,122 | $1,593 | $13,529 |
| 2015 | $1,575 | $15,400 | $1,593 | $13,807 |
| 2014 | $1,575 | $15,400 | $990 | $14,410 |
Source: Public Records
Map
Nearby Homes
- 2268 Tecumseh Rd
- 895 Quail Creek Dr
- 2354 Blue Spruce Dr
- 2366 Cypress Ln
- 5314 Kye Dr
- 4852 Montie Cir
- 5329 Kye Dr
- 1314 Glenwood Dr
- 2380 Holden Ln
- 882 Oakley Dr
- 2347 County Road 1214
- 2403 County Road 1205
- 768 Ranchwood Dr
- 707 Cedar Springs Dr
- 962 County Street 2983
- 954 County Street 2983
- 2400 County Road 1216
- 2401 County Road 1196
- 626 Audrey Dr
- 2391 County Road 1216
- 862 Cottontail Rd
- 763 S Sara Rd
- 2306 Squirrel Rd
- 2303 Squirrel Rd
- 2302 Squirrel Rd
- 738 S Sara Rd
- 764 S Sara Rd
- 870 Cottontail Rd
- 760 S Sara Rd
- 2310 Squirrel Rd
- 767 S Sara Rd
- 863 Cottontail Rd
- 750 S Sara Rd
- 2314 Squirrel Rd
- 869 Cottontail Rd
- 771 County St 2967
- 865 Brandie St
- 861 Brandie St
- 855 Brandie St
- 874 Cottontail Rd
Your Personal Tour Guide
Ask me questions while you tour the home.