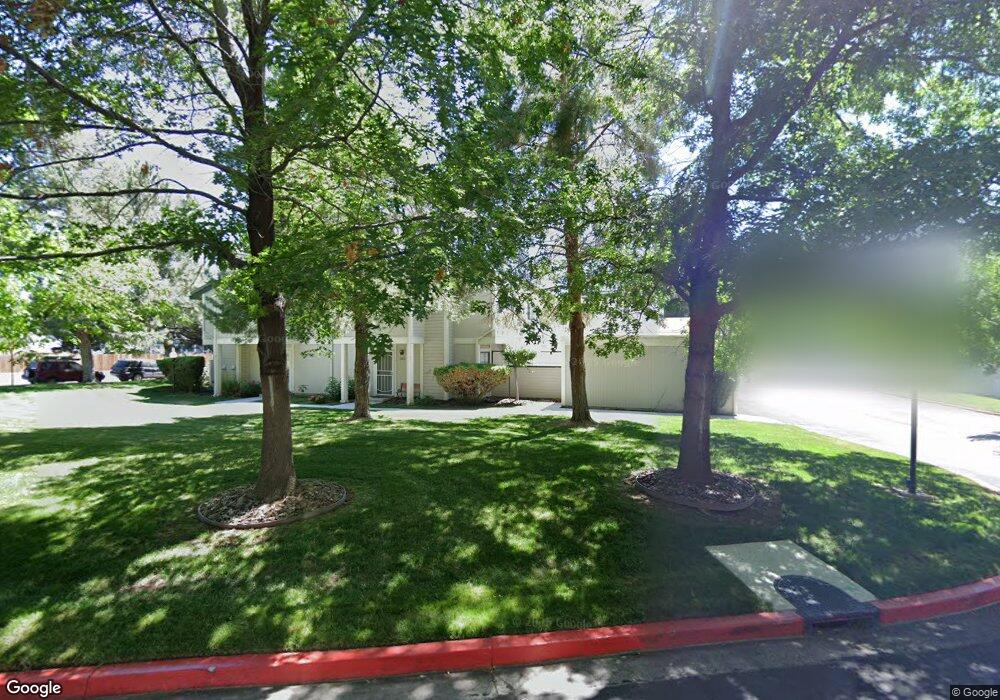
2301 Sycamore Glen Dr Unit 4 Sparks, NV 89434
Reed NeighborhoodEstimated Value: $279,059 - $311,000
2
Beds
2
Baths
1,068
Sq Ft
$281/Sq Ft
Est. Value
About This Home
This home is located at 2301 Sycamore Glen Dr Unit 4, Sparks, NV 89434 and is currently estimated at $299,765, approximately $280 per square foot. 2301 Sycamore Glen Dr Unit 4 is a home located in Washoe County with nearby schools including Lloyd Diedrichsen Elementary School, Lou Mendive Middle School, and Edward C Reed High School.
Ownership History
Date
Name
Owned For
Owner Type
Purchase Details
Closed on
May 14, 2025
Sold by
Brodhead Lynus Jay
Bought by
Brodhead Michael J and Brodhead Hwa-Di
Current Estimated Value
Purchase Details
Closed on
Dec 30, 1998
Sold by
Rockriver William A N and Rockriver Susanne K Y
Bought by
Brodhead Lynus J
Home Financials for this Owner
Home Financials are based on the most recent Mortgage that was taken out on this home.
Original Mortgage
$91,791
Interest Rate
6.63%
Mortgage Type
FHA
Purchase Details
Closed on
Oct 11, 1995
Sold by
Whitenack Scott C and Whitenack Anna M
Bought by
Rockriver William A N and Rockriver Susanne K Y
Home Financials for this Owner
Home Financials are based on the most recent Mortgage that was taken out on this home.
Original Mortgage
$58,500
Interest Rate
7.8%
Purchase Details
Closed on
Mar 1, 1994
Sold by
Szymanski Larry D and Szymanski Jane M
Bought by
Whitenack Scott C and Whitenack Anna M
Create a Home Valuation Report for This Property
The Home Valuation Report is an in-depth analysis detailing your home's value as well as a comparison with similar homes in the area
Home Values in the Area
Average Home Value in this Area
Purchase History
| Date | Buyer | Sale Price | Title Company |
|---|---|---|---|
| Brodhead Michael J | -- | None Listed On Document | |
| Brodhead Lynus J | $94,000 | -- | |
| Rockriver William A N | $88,500 | First American Title Co | |
| Whitenack Scott C | $10,000 | First Centennial Title Co |
Source: Public Records
Mortgage History
| Date | Status | Borrower | Loan Amount |
|---|---|---|---|
| Previous Owner | Brodhead Lynus J | $91,791 | |
| Previous Owner | Rockriver William A N | $58,500 |
Source: Public Records
Tax History Compared to Growth
Tax History
| Year | Tax Paid | Tax Assessment Tax Assessment Total Assessment is a certain percentage of the fair market value that is determined by local assessors to be the total taxable value of land and additions on the property. | Land | Improvement |
|---|---|---|---|---|
| 2026 | $628 | $43,124 | $21,735 | $21,389 |
| 2025 | $789 | $43,651 | $21,735 | $21,916 |
| 2024 | $766 | $42,461 | $20,160 | $22,301 |
| 2023 | $766 | $40,833 | $20,755 | $20,078 |
| 2022 | $744 | $34,506 | $16,940 | $17,567 |
| 2021 | $722 | $30,640 | $12,775 | $17,865 |
| 2020 | $698 | $31,283 | $13,020 | $18,263 |
| 2019 | $678 | $30,635 | $12,355 | $18,280 |
| 2018 | $658 | $25,269 | $7,140 | $18,129 |
| 2017 | $640 | $25,401 | $7,175 | $18,226 |
| 2016 | $624 | $25,291 | $6,475 | $18,816 |
| 2015 | $623 | $23,837 | $4,970 | $18,867 |
| 2014 | $605 | $17,626 | $3,535 | $14,091 |
| 2013 | -- | $16,170 | $2,625 | $13,545 |
Source: Public Records
Map
Nearby Homes
- 2407 Sunny Slope Dr Unit 1
- 2252 Sycamore Glen Dr
- 1990 Fargo Way
- 2679 Sycamore Glen Dr Unit 4
- 1280 O'Callaghan Dr
- 1770 Burnside Dr
- 1970 Woodhaven Ln
- 2688 Laguna Way
- 1290 Highgate Ct
- 1688 Round Mountain Cir
- 1544 Woodhaven Ln
- 1675 Round Mountain Cir
- 1332 Coachman Ct
- 914 Glen Martin Dr
- 913 Glen Molly Dr
- 1029 Baywood Dr Unit D
- 1973 Rio Tinto Dr
- 3127 Montezuma Way
- 1218 Junction Dr
- 3345 Groom Way
- 2301 Sycamore Glen Dr
- 2301 Sycamore Glen Dr Unit 1
- 2301 Sycamore Glen Dr
- 2301 Sycamore Glen Dr Unit 6
- 2301 Sycamore Glen Dr Unit 5
- 2301 Sycamore Glen Dr Unit 3
- 2301 Sycamore Glen Dr Unit 2
- 2301 Sycamore Glen Dr
- 2301 Sycamore Glen Dr
- 2301 Sycamore Glen Dr Unit 5
- 2301 Sycamore Glen Dr Unit 1
- 2311 Sycamore Glen Dr
- 2311 Sycamore Glen Dr Unit 1
- 2311 Sycamore Glen Dr Unit 7
- 2311 Sycamore Glen Dr
- 2311 Sycamore Glen Dr Unit 5
- 2311 Sycamore Glen Dr
- 2311 Sycamore Glen Dr Unit 6
- 2311 Sycamore Glen Dr Unit 3
- 2311 Sycamore Glen Dr Unit 2