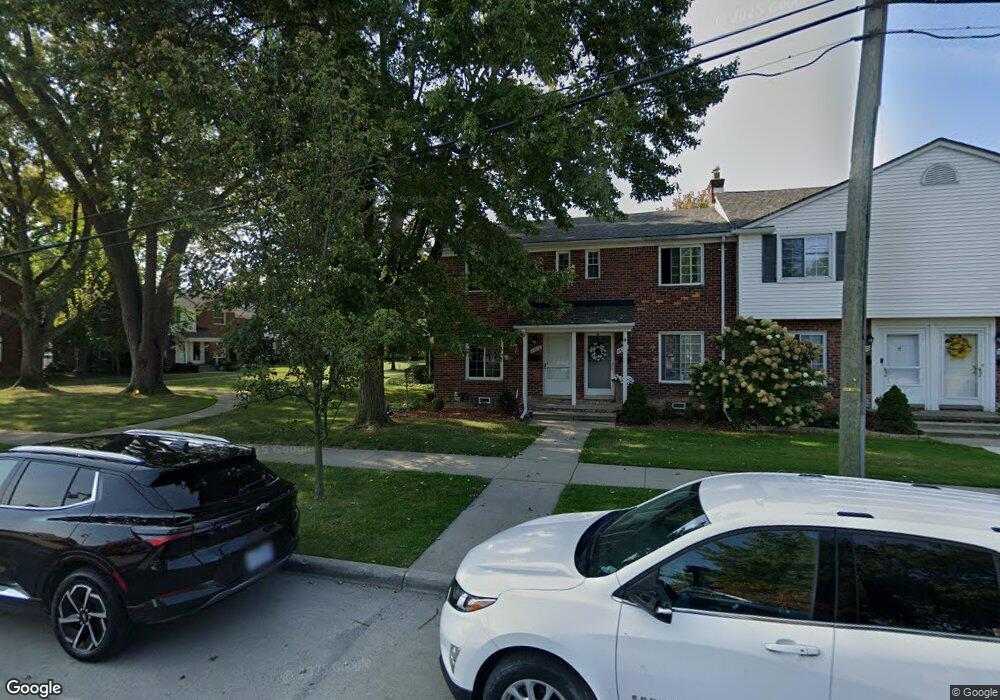
23010 Marter Rd Unit 23010 29 Saint Clair Shores, MI 48080
Estimated Value: $150,000 - $181,000
2
Beds
1
Bath
896
Sq Ft
$182/Sq Ft
Est. Value
About This Home
This home is located at 23010 Marter Rd Unit 23010 29, Saint Clair Shores, MI 48080 and is currently estimated at $163,341, approximately $182 per square foot. 23010 Marter Rd Unit 23010 29 is a home located in Macomb County with nearby schools including South Lake Middle School, South Lake High School, and St. Joan of Arc Elementary School.
Ownership History
Date
Name
Owned For
Owner Type
Purchase Details
Closed on
Aug 15, 2019
Sold by
Johnson Scott A
Bought by
Levigne Brigid
Current Estimated Value
Purchase Details
Closed on
Sep 13, 2017
Sold by
Winder Uii George and Moore Ariadne R
Bought by
Johnson Scott Allen and Johnson Scott A
Purchase Details
Closed on
Mar 6, 2012
Sold by
Bank Of America Na
Bought by
Fannie Mae and Federal National Mortgage Association
Purchase Details
Closed on
Feb 2, 2012
Sold by
Pageau Jeffrey J and Pageau Michelle
Bought by
Bank Of America Na
Purchase Details
Closed on
Feb 20, 2002
Sold by
Marone Michael R
Bought by
Pageau Jeffery J
Home Financials for this Owner
Home Financials are based on the most recent Mortgage that was taken out on this home.
Original Mortgage
$81,750
Interest Rate
7.11%
Mortgage Type
Purchase Money Mortgage
Create a Home Valuation Report for This Property
The Home Valuation Report is an in-depth analysis detailing your home's value as well as a comparison with similar homes in the area
Home Values in the Area
Average Home Value in this Area
Purchase History
| Date | Buyer | Sale Price | Title Company |
|---|---|---|---|
| Levigne Brigid | $90,000 | None Available | |
| Johnson Scott Allen | $88,000 | Premier Title Agency Llc | |
| Fannie Mae | -- | None Available | |
| Bank Of America Na | $85,722 | None Available | |
| Pageau Jeffery J | $102,200 | -- |
Source: Public Records
Mortgage History
| Date | Status | Borrower | Loan Amount |
|---|---|---|---|
| Previous Owner | Pageau Jeffery J | $81,750 |
Source: Public Records
Tax History Compared to Growth
Tax History
| Year | Tax Paid | Tax Assessment Tax Assessment Total Assessment is a certain percentage of the fair market value that is determined by local assessors to be the total taxable value of land and additions on the property. | Land | Improvement |
|---|---|---|---|---|
| 2025 | $2,589 | $74,200 | $0 | $0 |
| 2024 | $2,589 | $66,800 | $0 | $0 |
| 2023 | $2,465 | $58,400 | $0 | $0 |
| 2022 | $2,288 | $52,400 | $0 | $0 |
| 2021 | $2,396 | $48,000 | $0 | $0 |
| 2020 | $2,406 | $43,800 | $0 | $0 |
| 2019 | $2,275 | $38,800 | $0 | $0 |
| 2018 | $2,235 | $31,800 | $0 | $0 |
| 2017 | $881 | $27,700 | $900 | $26,800 |
| 2016 | $820 | $27,700 | $0 | $0 |
| 2015 | $809 | $23,200 | $0 | $0 |
| 2012 | -- | $19,800 | $900 | $18,900 |
Source: Public Records
Map
Nearby Homes
- 23112 Marter Rd
- 23107 Arthur Ct Unit 285
- 23063 Gary Ln Unit 223
- 22980 Gary Ln Unit 431
- 22956 Gary Ln Unit 419
- 22852 Allen Ct Unit 150
- 22925 Gary Ln Unit 77
- 22927 Lakeshore Dr Unit 495
- 22948 Lingemann St
- 23007 Kipling St
- 23342 Edsel Ford Ct Unit 46
- 22997 Carolina St
- 23225 Liberty St
- 23611 Jefferson Ave
- 23016 Pleasant St
- 22726 Lingemann St
- 3001 Harbor Place Dr
- 412 Riviera Dr
- 23233 Robert John St
- 510 Riviera Dr Unit 157
- 23010 Marter Rd Unit 9
- 23012 Marter Rd
- 23010 Marter Rd
- 23006 Marter Rd
- 23004 Marter Rd
- 23002 Marter Rd
- 23000 Marter Rd Unit 312
- 23004 Marter Rd Unit 314
- 22959 Lee Ct Unit Bldg-Unit
- 22969 Lee Ct
- 22965 Lee Ct Unit 334
- 22963 Lee Ct
- 22961 Lee Ct
- 22959 Lee Ct Unit 331
- 22957 Lee Ct
- 22955 Lee Ct
- 22953 Lee Ct
- 22951 Lee Ct
- 22974 Marter Rd Unit Bldg-Unit
- 22980 Marter Rd Unit 308