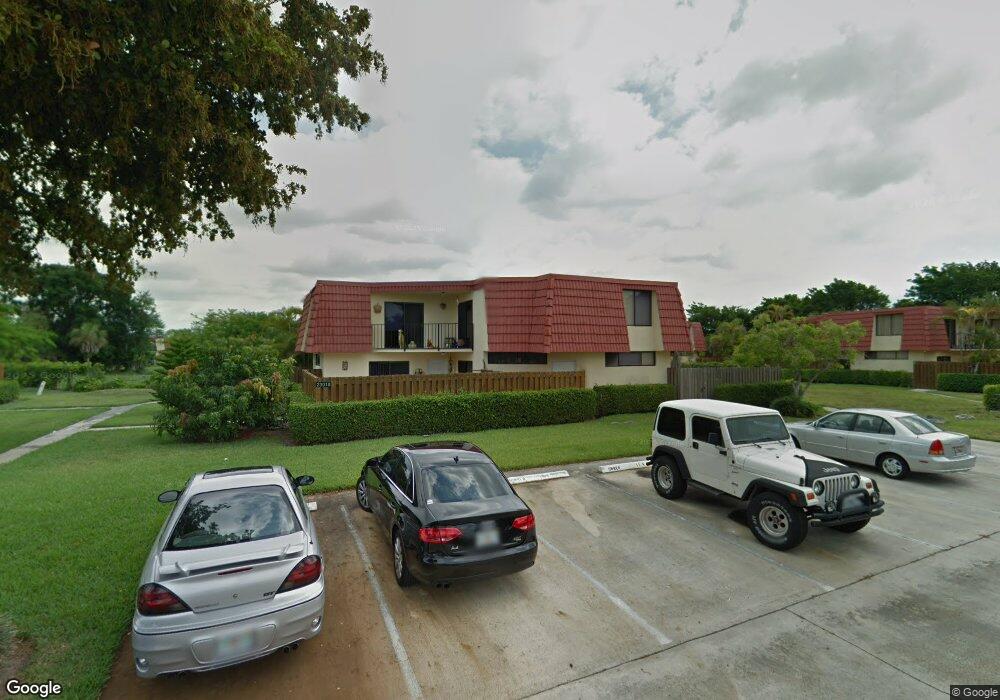
23018 Oxford Place Unit B Boca Raton, FL 33433
Sandalfoot Cove NeighborhoodEstimated Value: $252,000 - $420,000
2
Beds
3
Baths
1,312
Sq Ft
$260/Sq Ft
Est. Value
About This Home
This home is located at 23018 Oxford Place Unit B, Boca Raton, FL 33433 and is currently estimated at $340,952, approximately $259 per square foot. 23018 Oxford Place Unit B is a home located in Palm Beach County with nearby schools including Hammock Pointe Elementary School, Spanish River Community High School, and Omni Middle School.
Ownership History
Date
Name
Owned For
Owner Type
Purchase Details
Closed on
Nov 22, 2011
Sold by
Crawford Friday Rose
Bought by
Rodgers Jeremy and Rodgers Amanda
Current Estimated Value
Purchase Details
Closed on
Jun 7, 2002
Sold by
Moran Juan and Moran Melissa R
Bought by
Crawford Friday Rose
Home Financials for this Owner
Home Financials are based on the most recent Mortgage that was taken out on this home.
Original Mortgage
$120,000
Interest Rate
8.8%
Purchase Details
Closed on
Jan 24, 2000
Sold by
Wilkes Robert G and Wilkes Lana M
Bought by
Moran Juan
Home Financials for this Owner
Home Financials are based on the most recent Mortgage that was taken out on this home.
Original Mortgage
$89,700
Interest Rate
7.87%
Mortgage Type
FHA
Purchase Details
Closed on
Jun 15, 1998
Sold by
Baez Mirta
Bought by
Wilkes Robert G and Wilkes Lana M
Purchase Details
Closed on
May 9, 1996
Sold by
Baez Julio
Bought by
Baez Mirta
Create a Home Valuation Report for This Property
The Home Valuation Report is an in-depth analysis detailing your home's value as well as a comparison with similar homes in the area
Home Values in the Area
Average Home Value in this Area
Purchase History
| Date | Buyer | Sale Price | Title Company |
|---|---|---|---|
| Rodgers Jeremy | $72,000 | First Intl Title Inc | |
| Crawford Friday Rose | $120,000 | Patch Reef Title Company Inc | |
| Moran Juan | $90,500 | -- | |
| Wilkes Robert G | $75,800 | -- | |
| Baez Mirta | $100 | -- |
Source: Public Records
Mortgage History
| Date | Status | Borrower | Loan Amount |
|---|---|---|---|
| Previous Owner | Crawford Friday Rose | $120,000 | |
| Previous Owner | Baez Mirta | $17,020 | |
| Previous Owner | Baez Mirta | $15,000 | |
| Previous Owner | Baez Mirta | $89,700 |
Source: Public Records
Tax History Compared to Growth
Tax History
| Year | Tax Paid | Tax Assessment Tax Assessment Total Assessment is a certain percentage of the fair market value that is determined by local assessors to be the total taxable value of land and additions on the property. | Land | Improvement |
|---|---|---|---|---|
| 2024 | $4,529 | $230,351 | -- | -- |
| 2023 | $4,285 | $209,410 | $0 | $0 |
| 2022 | $3,939 | $190,373 | $0 | $0 |
| 2021 | $3,487 | $196,484 | $0 | $196,484 |
| 2020 | $3,243 | $181,484 | $0 | $181,484 |
| 2019 | $3,097 | $176,484 | $0 | $176,484 |
| 2018 | $2,756 | $160,717 | $0 | $160,717 |
| 2017 | $2,596 | $153,217 | $0 | $0 |
| 2016 | $2,487 | $107,460 | $0 | $0 |
| 2015 | $2,390 | $97,691 | $0 | $0 |
| 2014 | $2,171 | $88,810 | $0 | $0 |
Source: Public Records
Map
Nearby Homes
- 8155 Scenic Turn
- 23157 Addison Lakes Cir
- 8176 Scenic Turn
- 22940 Oxford Place Unit B
- 8057 Severn Dr Unit A
- 7844 La Mirada Dr
- 7834 La Mirada Dr
- 7876 La Mirada Dr
- 7804 La Mirada Dr Unit 8BR
- 7829 La Mirada Dr
- 7904 Travelers Tree Dr
- 7894 Granada Place Unit 1004
- 7878 Seville Place Unit 2503
- 7771 La Mirada Dr
- 7882 Granada Place Unit 8040
- 8116 Severn Dr Unit C
- 8353 Huntsman Place
- 8122 Severn Dr Unit A
- 7860 Seville Place Unit 2203
- 8443 Garden Gate Place
- 23018 Oxford Place Unit C
- 23018 Oxford Place Unit D
- 23018 Oxford Place Unit A
- 23024 Oxford Place Unit 1D
- 23024 Oxford Place Unit C
- 23024 Oxford Place Unit A
- 23024 Oxford Place Unit B
- 23024 Oxford Place Unit D
- 23012 Oxford Place
- 23012 Oxford Place Unit C
- 23012 Oxford Place Unit B
- 23012 Oxford Place Unit D
- 23012 Oxford Place Unit A
- 23030 Oxford Place Unit D
- 23030 Oxford Place Unit B
- 23030 Oxford Place Unit A
- 23030 Oxford Place Unit C
- 23036 Oxford Place Unit D