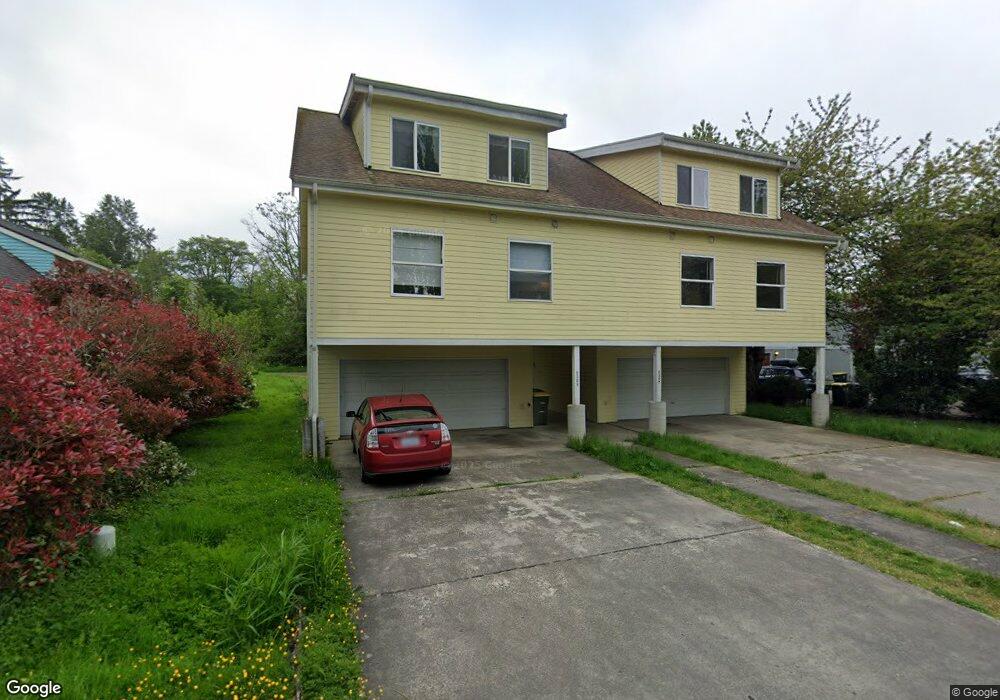
2302 2304 Happy Ct Bellingham, WA 98225
Happy Valley NeighborhoodEstimated Value: $875,000 - $1,172,616
4
Beds
2
Baths
2,621
Sq Ft
$387/Sq Ft
Est. Value
About This Home
This home is located at 2302 2304 Happy Ct, Bellingham, WA 98225 and is currently estimated at $1,014,904, approximately $387 per square foot. 2302 2304 Happy Ct is a home located in Whatcom County with nearby schools including Happy Valley Elementary School, Fairhaven Middle School, and Sehome High School.
Ownership History
Date
Name
Owned For
Owner Type
Purchase Details
Closed on
Jun 1, 2020
Sold by
Blatter Brock and Mccolloch Sally
Bought by
Toor Navdeep K
Current Estimated Value
Home Financials for this Owner
Home Financials are based on the most recent Mortgage that was taken out on this home.
Original Mortgage
$621,000
Outstanding Balance
$553,517
Interest Rate
3.5%
Mortgage Type
New Conventional
Estimated Equity
$461,387
Purchase Details
Closed on
Dec 7, 2009
Sold by
Canyon Holdings Llc Series 28
Bought by
Blatter Brock and Mccolloch Sally
Home Financials for this Owner
Home Financials are based on the most recent Mortgage that was taken out on this home.
Original Mortgage
$341,250
Interest Rate
5.01%
Mortgage Type
New Conventional
Purchase Details
Closed on
Mar 19, 2006
Sold by
Canyon Holdings Llc
Bought by
Canyon Holdings Llc Series 28
Purchase Details
Closed on
Mar 15, 2005
Sold by
Stebner Derek R
Bought by
Canyon Holdings Llc
Purchase Details
Closed on
Dec 13, 2001
Sold by
Stebner Kena
Bought by
Stebner Derek R
Create a Home Valuation Report for This Property
The Home Valuation Report is an in-depth analysis detailing your home's value as well as a comparison with similar homes in the area
Home Values in the Area
Average Home Value in this Area
Purchase History
| Date | Buyer | Sale Price | Title Company |
|---|---|---|---|
| Toor Navdeep K | $690,000 | Whatcom Land Title | |
| Blatter Brock | $455,280 | Whatcom Land Title | |
| Canyon Holdings Llc Series 28 | -- | None Available | |
| Canyon Holdings Llc | -- | -- | |
| Stebner Derek R | -- | Stewart Title | |
| Stebner Derek R | -- | Stewart Title |
Source: Public Records
Mortgage History
| Date | Status | Borrower | Loan Amount |
|---|---|---|---|
| Open | Toor Navdeep K | $621,000 | |
| Previous Owner | Blatter Brock | $341,250 |
Source: Public Records
Tax History Compared to Growth
Tax History
| Year | Tax Paid | Tax Assessment Tax Assessment Total Assessment is a certain percentage of the fair market value that is determined by local assessors to be the total taxable value of land and additions on the property. | Land | Improvement |
|---|---|---|---|---|
| 2024 | $8,318 | $1,032,325 | $422,350 | $609,975 |
| 2023 | $8,318 | $1,069,233 | $437,450 | $631,783 |
| 2022 | $6,850 | $909,991 | $372,300 | $537,691 |
| 2021 | $6,508 | $733,883 | $300,250 | $433,633 |
| 2020 | $6,395 | $643,752 | $263,375 | $380,377 |
| 2019 | $5,328 | $611,060 | $250,000 | $361,060 |
| 2018 | $5,509 | $510,499 | $169,260 | $341,239 |
| 2017 | $4,860 | $453,140 | $150,240 | $302,900 |
| 2016 | $4,425 | $417,327 | $138,240 | $279,087 |
| 2015 | $4,356 | $395,839 | $131,040 | $264,799 |
| 2014 | -- | $376,979 | $124,800 | $252,179 |
| 2013 | -- | $358,129 | $120,000 | $238,129 |
Source: Public Records
Map
Nearby Homes
- 2400 Donovan Ave Unit 13
- 2100 Lindsay Ave
- 1306 23rd St
- 1902 Wilson Ave
- 2694 Donovan Ave Unit 32
- 2015 24th St Unit 31
- 1121 22nd St
- 1605 Donovan Ave
- 3104 Wilson Ave
- 926 24th St
- 923 24th St
- 2815 Willis St
- 1302 Larrabee Ave
- 331 Chuckanut Dr N
- 425 Chuckanut Dr N Unit 5
- 1212 Old Fairhaven Pkwy Unit D202
- 1315 Mill Ave
- 1005 15th St
- 2600 16th St
- 1100 12th St
- 2302 Happy Ct
- 2306 Happy Ct
- 2218 Happy Ct
- 2212 Wilson Ave Unit A-B
- 2212 Wilson Ave
- 2322 Happy Ct
- 2300 Wilson Ave
- 2300 - 2302 Wilson Ave
- 2304 Wilson Ave
- 2210 Wilson Ave
- 2321 Happy Ct
- 2306 Wilson Ave Unit A & B
- 2306 Wilson Ave
- 2214 Wilson Ave
- 1812 24th St
- 2330 Happy Ct
- 2330 Happy Ct
- 1717 22nd St
- 2208 Wilson Ave
- 1727 22nd St