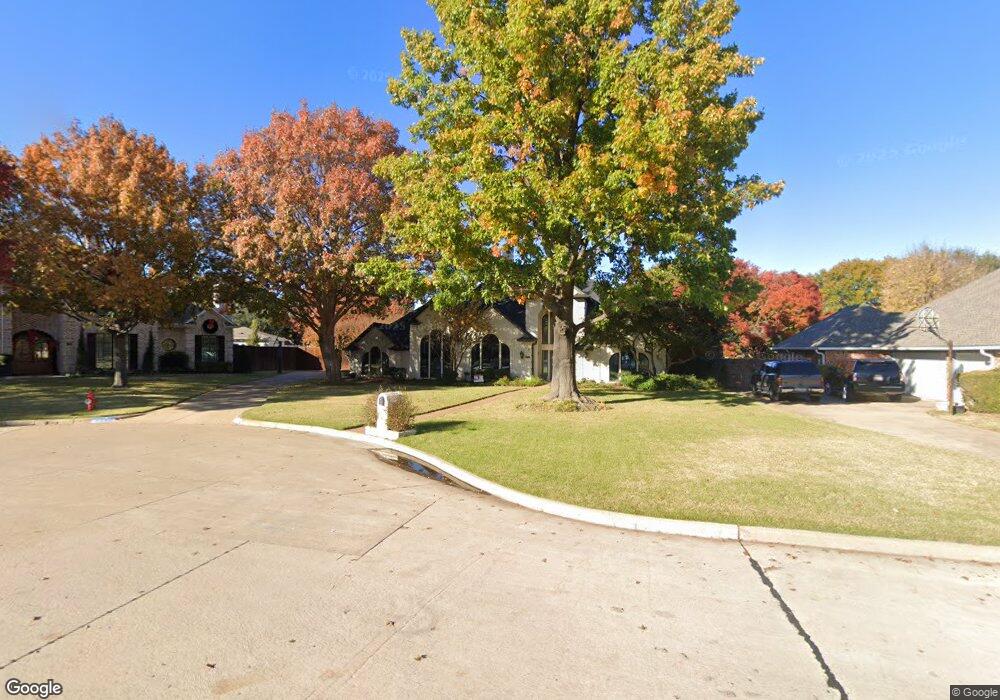
2302 Arbor Trail Colleyville, TX 76034
Estimated Value: $915,000 - $1,014,000
4
Beds
5
Baths
3,859
Sq Ft
$251/Sq Ft
Est. Value
About This Home
This home is located at 2302 Arbor Trail, Colleyville, TX 76034 and is currently estimated at $967,210, approximately $250 per square foot. 2302 Arbor Trail is a home located in Tarrant County with nearby schools including O.C. Taylor Elementary School, Colleyville Middle School, and Waypoint Montessori.
Ownership History
Date
Name
Owned For
Owner Type
Purchase Details
Closed on
Jun 21, 2010
Sold by
Crane Lori Anne
Bought by
Jach Anthony and Jach Sarah
Current Estimated Value
Home Financials for this Owner
Home Financials are based on the most recent Mortgage that was taken out on this home.
Original Mortgage
$384,000
Outstanding Balance
$256,092
Interest Rate
4.87%
Mortgage Type
New Conventional
Estimated Equity
$711,118
Purchase Details
Closed on
Apr 19, 2001
Sold by
Burch Norman T and Burch Yvonne
Bought by
Crane Robert J and Crane Lori
Home Financials for this Owner
Home Financials are based on the most recent Mortgage that was taken out on this home.
Original Mortgage
$252,000
Interest Rate
6.93%
Purchase Details
Closed on
Dec 15, 1995
Sold by
Walsh Keith Thomas and Fitzpatrick Kathy
Bought by
Burch Norman T and Burch Yvonne
Home Financials for this Owner
Home Financials are based on the most recent Mortgage that was taken out on this home.
Original Mortgage
$188,000
Interest Rate
7.4%
Create a Home Valuation Report for This Property
The Home Valuation Report is an in-depth analysis detailing your home's value as well as a comparison with similar homes in the area
Home Values in the Area
Average Home Value in this Area
Purchase History
| Date | Buyer | Sale Price | Title Company |
|---|---|---|---|
| Jach Anthony | -- | Hftc | |
| Crane Robert J | -- | Rattikin Title Co | |
| Burch Norman T | -- | Commonwealth Land Title |
Source: Public Records
Mortgage History
| Date | Status | Borrower | Loan Amount |
|---|---|---|---|
| Open | Jach Anthony | $384,000 | |
| Previous Owner | Crane Robert J | $252,000 | |
| Previous Owner | Burch Norman T | $188,000 |
Source: Public Records
Tax History Compared to Growth
Tax History
| Year | Tax Paid | Tax Assessment Tax Assessment Total Assessment is a certain percentage of the fair market value that is determined by local assessors to be the total taxable value of land and additions on the property. | Land | Improvement |
|---|---|---|---|---|
| 2025 | $3,208 | $801,250 | $237,200 | $564,050 |
| 2024 | $3,208 | $815,000 | $237,200 | $577,800 |
| 2023 | $12,083 | $902,000 | $237,200 | $664,800 |
| 2022 | $12,860 | $774,025 | $237,200 | $536,825 |
| 2021 | $13,000 | $591,961 | $142,320 | $449,641 |
| 2020 | $13,666 | $615,000 | $142,320 | $472,680 |
| 2019 | $13,581 | $613,024 | $142,320 | $470,704 |
| 2018 | $3,175 | $534,000 | $95,000 | $439,000 |
| 2017 | $12,534 | $530,570 | $95,000 | $435,570 |
| 2016 | $12,346 | $526,785 | $95,000 | $431,785 |
| 2015 | $10,812 | $475,100 | $50,000 | $425,100 |
| 2014 | $10,812 | $475,100 | $50,000 | $425,100 |
Source: Public Records
Map
Nearby Homes
- 5504 Sycamore Dr
- 5404 Miramar Ln
- 5613 Versailles Ct
- 3216 Glade Rd
- 1808 Arthur Dr
- 5508 Coventry Ct
- 2906 Cottonwood Ln
- 2906 Edgewood Ln
- 4214 Hearthside Dr
- 4723 Bill Simmons Rd
- 4213 Hearthside Dr
- 4816 Bill Simmons Rd
- Lot 4 Amelia Ct
- 4282 Hearthside Dr
- 1813 Grosvenor Green
- 5317 Bluebonnet Dr
- 1512 Four Seasons Dr
- 4612 Bill Simmons Rd
- 3329 Moss Creek Dr
- 1916 Renfro Rd
- 2300 Arbor Trail
- 2304 Arbor Trail
- 2303 Poplar Ln
- 2301 Poplar Ln
- 2305 Poplar Ln
- 2306 Arbor Trail
- 2301 Arbor Trail
- 2305 Arbor Trail
- 2303 Arbor Trail
- 5405 Sycamore Ct
- 5409 Sycamore Ct
- 2307 Poplar Ln
- 2307 Arbor Trail
- 5403 Sycamore Ct
- 5411 Sycamore Ct
- 5600 Poplar Ct W
- 5401 Sycamore Ct
- 2400 Arbor Trail
- 2309 Arbor Trail
- 5601 Poplar Ct W