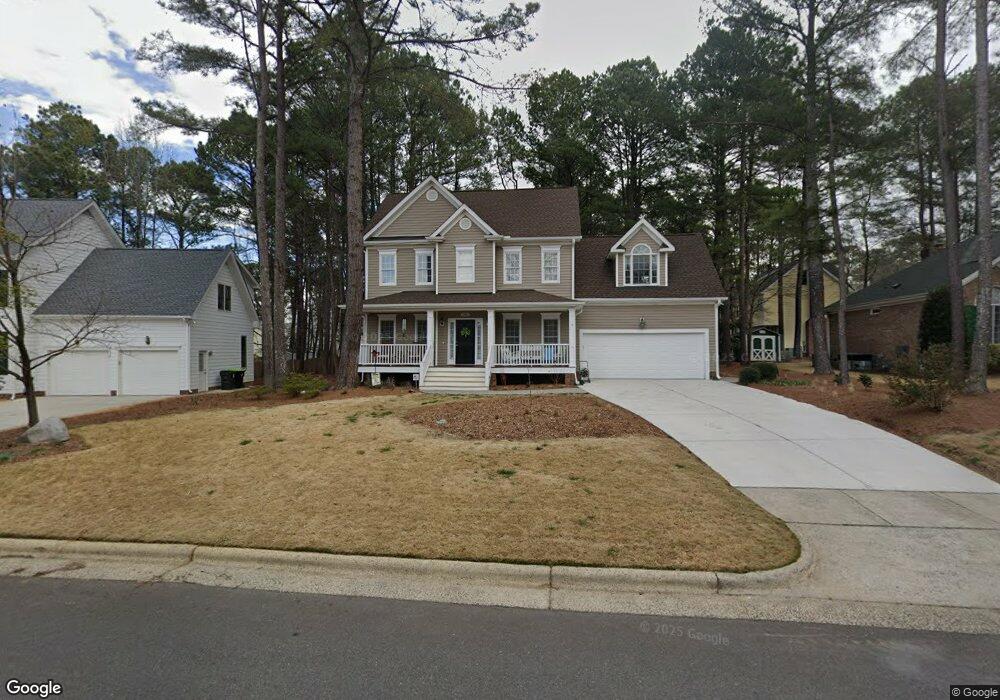
2302 Bristers Spring Way Apex, NC 27523
Beaver Creek NeighborhoodEstimated Value: $613,000 - $656,000
3
Beds
3
Baths
2,130
Sq Ft
$299/Sq Ft
Est. Value
About This Home
This home is located at 2302 Bristers Spring Way, Apex, NC 27523 and is currently estimated at $637,085, approximately $299 per square foot. 2302 Bristers Spring Way is a home located in Wake County with nearby schools including Turner Creek Elementary School, Salem Middle, and Green Level High School.
Ownership History
Date
Name
Owned For
Owner Type
Purchase Details
Closed on
Apr 5, 2001
Sold by
Hood Robert Scott
Bought by
Butler Andrew A and Butler Sarah B
Current Estimated Value
Home Financials for this Owner
Home Financials are based on the most recent Mortgage that was taken out on this home.
Original Mortgage
$183,200
Outstanding Balance
$67,987
Interest Rate
7.11%
Estimated Equity
$569,098
Purchase Details
Closed on
Apr 29, 1999
Sold by
Hughey James F
Bought by
Hood Robert Scott and Hood Vicki Fontenot
Home Financials for this Owner
Home Financials are based on the most recent Mortgage that was taken out on this home.
Original Mortgage
$175,900
Interest Rate
7.06%
Purchase Details
Closed on
Sep 1, 1998
Sold by
Apex Properites Llc
Bought by
Hughey James F
Home Financials for this Owner
Home Financials are based on the most recent Mortgage that was taken out on this home.
Original Mortgage
$31,125
Interest Rate
6.95%
Mortgage Type
Construction
Create a Home Valuation Report for This Property
The Home Valuation Report is an in-depth analysis detailing your home's value as well as a comparison with similar homes in the area
Home Values in the Area
Average Home Value in this Area
Purchase History
| Date | Buyer | Sale Price | Title Company |
|---|---|---|---|
| Butler Andrew A | $229,000 | -- | |
| Hood Robert Scott | $220,000 | -- | |
| Hughey James F | $41,500 | -- |
Source: Public Records
Mortgage History
| Date | Status | Borrower | Loan Amount |
|---|---|---|---|
| Open | Butler Andrew A | $183,200 | |
| Previous Owner | Hood Robert Scott | $175,900 | |
| Previous Owner | Hughey James F | $31,125 |
Source: Public Records
Tax History Compared to Growth
Tax History
| Year | Tax Paid | Tax Assessment Tax Assessment Total Assessment is a certain percentage of the fair market value that is determined by local assessors to be the total taxable value of land and additions on the property. | Land | Improvement |
|---|---|---|---|---|
| 2025 | $5,529 | $630,920 | $220,000 | $410,920 |
| 2024 | $5,405 | $630,920 | $220,000 | $410,920 |
| 2023 | $4,204 | $381,409 | $85,000 | $296,409 |
| 2022 | $3,947 | $381,409 | $85,000 | $296,409 |
| 2021 | $3,568 | $358,355 | $85,000 | $273,355 |
| 2020 | $3,532 | $358,355 | $85,000 | $273,355 |
| 2019 | $3,762 | $329,455 | $80,000 | $249,455 |
| 2018 | $3,543 | $329,455 | $80,000 | $249,455 |
| 2017 | $3,298 | $329,455 | $80,000 | $249,455 |
| 2016 | $3,250 | $329,455 | $80,000 | $249,455 |
| 2015 | $3,225 | $319,032 | $70,000 | $249,032 |
| 2014 | $3,108 | $319,032 | $70,000 | $249,032 |
Source: Public Records
Map
Nearby Homes
- 2300 Walden Creek Dr
- 1622 Shepherds Glade Dr
- 1633 Shepherds Glade Dr
- 2208 Good Shepherd Way
- 2201 Dial Dr
- 2060 Jersey City Place
- 2122 Grouse Ski Cir
- 2115 Grouse Ski Cir
- 2134 Grouse Ski Cir
- 2127 Grouse Ski Cir
- 831 Tunisian Dr
- 7242 Morris Acres Rd
- 2013 Keokuk Ct
- 479 Clark Creek Ln
- 2126 Whitesmith Dr
- 1001 Drayman Place
- 1038 Brownsmith Dr
- 709 Oak Ridge Dr
- 700 Oak Ridge Dr
- 721 Oak Ridge Dr
- 2304 Bristers Spring Way
- 2222 Walden Creek Dr
- 2220 Walden Creek Dr
- 1801 Dunwick Ct
- 2306 Bristers Spring Way
- 2303 Bristers Spring Way
- 1803 Dunwick Ct
- 2218 Walden Creek Dr
- 2001 Walden Glade Run
- 2307 Bristers Spring Way
- 2308 Bristers Spring Way
- 1700 Green Hickory Ct
- 1800 Dunwick Ct
- 2214 Walden Creek Dr
- 2221 Walden Creek Dr
- 1805 Dunwick Ct
- 1702 Green Hickory Ct
- 2000 Walden Glade Run
- 2219 Walden Creek Dr
- 2311 Bristers Spring Way