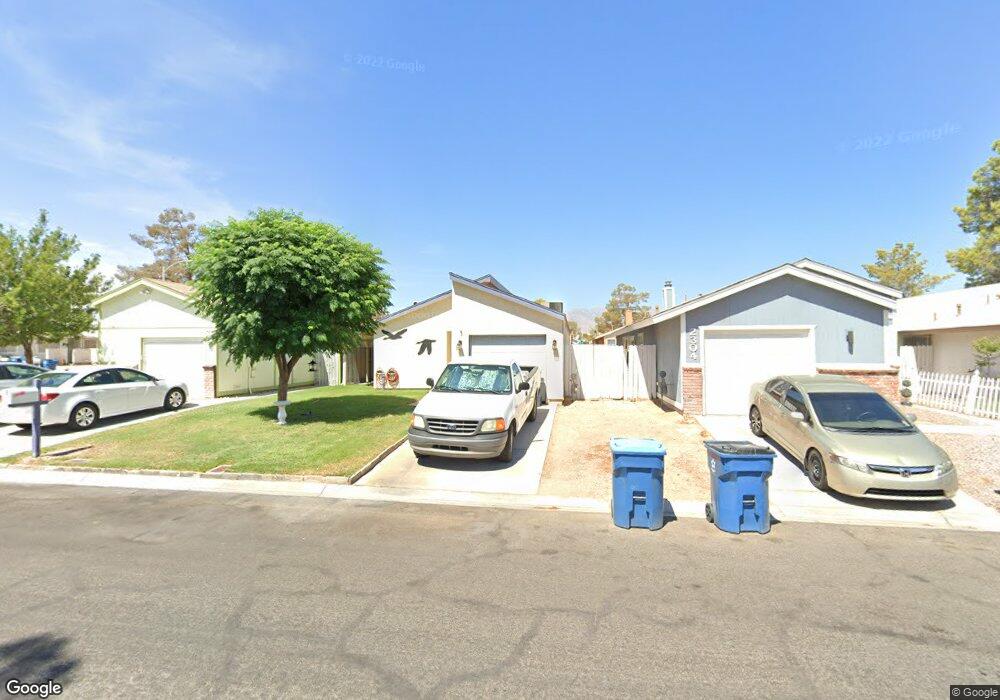
2302 El Cerrito Cir Las Vegas, NV 89108
Michael Way NeighborhoodEstimated Value: $278,511 - $319,000
2
Beds
2
Baths
1,098
Sq Ft
$273/Sq Ft
Est. Value
About This Home
This home is located at 2302 El Cerrito Cir, Las Vegas, NV 89108 and is currently estimated at $299,878, approximately $273 per square foot. 2302 El Cerrito Cir is a home located in Clark County with nearby schools including Bertha Ronzone Elementary School, J. Harold Brinley Middle School, and Cimarron Memorial High School.
Ownership History
Date
Name
Owned For
Owner Type
Purchase Details
Closed on
Jul 27, 2004
Sold by
Doles Jacqueline M
Bought by
Evans Charles
Current Estimated Value
Home Financials for this Owner
Home Financials are based on the most recent Mortgage that was taken out on this home.
Original Mortgage
$132,000
Outstanding Balance
$66,713
Interest Rate
6.29%
Mortgage Type
Unknown
Estimated Equity
$233,165
Purchase Details
Closed on
Dec 13, 2002
Sold by
Peddy Robert O
Bought by
Doles Jacqueline M
Home Financials for this Owner
Home Financials are based on the most recent Mortgage that was taken out on this home.
Original Mortgage
$113,400
Interest Rate
8.94%
Purchase Details
Closed on
Apr 30, 1997
Sold by
Frehner Duane and Frehner Sandra
Bought by
Peddy Robert O
Home Financials for this Owner
Home Financials are based on the most recent Mortgage that was taken out on this home.
Original Mortgage
$86,700
Interest Rate
7.98%
Mortgage Type
VA
Create a Home Valuation Report for This Property
The Home Valuation Report is an in-depth analysis detailing your home's value as well as a comparison with similar homes in the area
Home Values in the Area
Average Home Value in this Area
Purchase History
| Date | Buyer | Sale Price | Title Company |
|---|---|---|---|
| Evans Charles | $152,000 | National Title Company | |
| Doles Jacqueline M | $113,400 | Equity Title | |
| Peddy Robert O | $85,000 | First American Title Co |
Source: Public Records
Mortgage History
| Date | Status | Borrower | Loan Amount |
|---|---|---|---|
| Open | Evans Charles | $132,000 | |
| Previous Owner | Doles Jacqueline M | $113,400 | |
| Previous Owner | Peddy Robert O | $86,700 |
Source: Public Records
Tax History Compared to Growth
Tax History
| Year | Tax Paid | Tax Assessment Tax Assessment Total Assessment is a certain percentage of the fair market value that is determined by local assessors to be the total taxable value of land and additions on the property. | Land | Improvement |
|---|---|---|---|---|
| 2025 | $678 | $46,501 | $26,600 | $19,901 |
| 2024 | $659 | $46,501 | $26,600 | $19,901 |
| 2023 | $659 | $44,999 | $25,200 | $19,799 |
| 2022 | $639 | $36,630 | $18,200 | $18,430 |
| 2021 | $621 | $36,093 | $18,200 | $17,893 |
| 2020 | $600 | $34,191 | $16,100 | $18,091 |
| 2019 | $582 | $32,449 | $14,350 | $18,099 |
| 2018 | $565 | $30,276 | $12,600 | $17,676 |
| 2017 | $928 | $28,293 | $10,150 | $18,143 |
| 2016 | $537 | $25,426 | $6,650 | $18,776 |
| 2015 | $534 | $21,611 | $5,250 | $16,361 |
| 2014 | $519 | $22,534 | $3,500 | $19,034 |
Source: Public Records
Map
Nearby Homes
- 6231 Santa Maria Ave
- 2405 Valparaiso St
- 6204 Robin Hood Cir
- 6324 Eugene Ave
- 2204 Tall Pine Dr
- 2512 Rialto Rd
- 6120 Rosalita Ave
- 6465 Big Pine Way
- 2228 Silver Pine Dr Unit 3
- 6437 Peachwood Rd
- 6444 Peartree Rd
- 2433 Cycad Tree St
- 2248 Short Pine Dr
- 2204 Short Pine Dr
- 6216 Molino St
- 2499 N Jones Blvd
- 2120 Chertsey Dr Unit C
- 2536 Charteroak St
- 6400 Deadwood Rd
- 6215 Don Zarembo Ave
- 2304 El Cerrito Cir
- 2300 El Cerrito Cir
- 2303 El Molino Cir Unit 2
- 2308 El Cerrito Cir
- 2301 El Molino Cir
- 2307 El Molino Cir
- 2310 El Cerrito Cir
- 2310 El Cerrito Cir Unit n/a
- 2309 El Molino Cir
- 2303 El Cerrito Cir
- 2305 El Cerrito Cir
- 2301 El Cerrito Cir
- 6309 Santa Maria Ave
- 2307 El Cerrito Cir
- 6313 Santa Maria Ave
- 2311 El Molino Cir
- 2312 El Cerrito Cir
- 6305 Santa Maria Ave