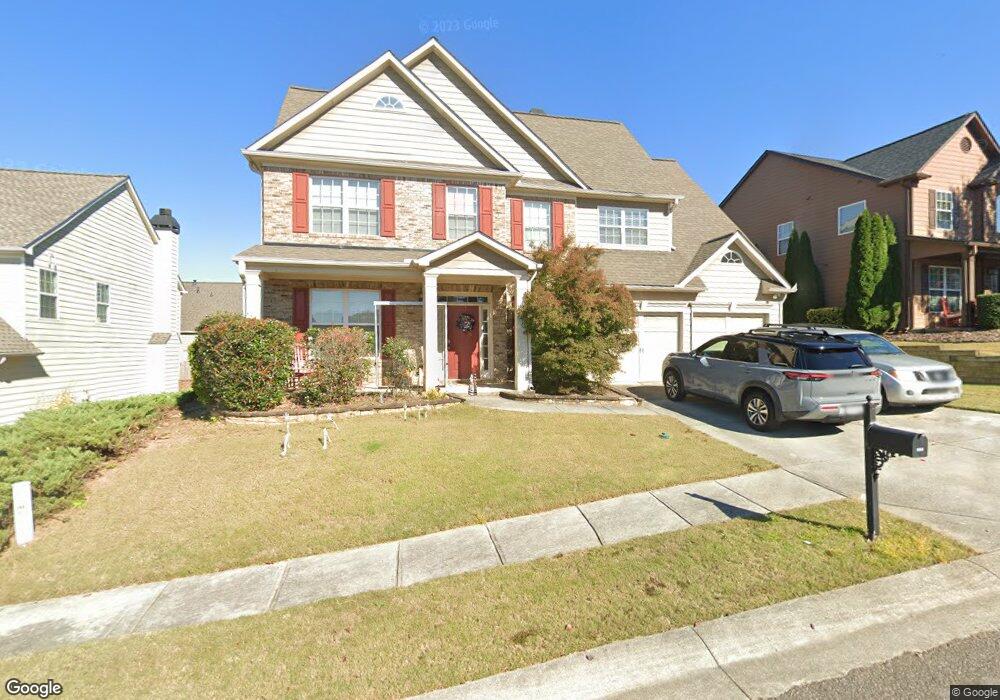
2302 Loowit Falls Dr Braselton, GA 30517
Estimated Value: $443,000 - $472,000
5
Beds
4
Baths
2,925
Sq Ft
$156/Sq Ft
Est. Value
About This Home
This home is located at 2302 Loowit Falls Dr, Braselton, GA 30517 and is currently estimated at $456,726, approximately $156 per square foot. 2302 Loowit Falls Dr is a home located in Barrow County with nearby schools including Bramlett Elementary School, Russell Middle School, and Winder-Barrow High School.
Ownership History
Date
Name
Owned For
Owner Type
Purchase Details
Closed on
Dec 2, 2021
Sold by
Nieves Enrique
Bought by
Nieves Erika
Current Estimated Value
Purchase Details
Closed on
Aug 4, 2017
Sold by
Morris Thomas E
Bought by
Nieves Erika and Nieves Enrique
Home Financials for this Owner
Home Financials are based on the most recent Mortgage that was taken out on this home.
Original Mortgage
$234,351
Interest Rate
3.87%
Mortgage Type
FHA
Purchase Details
Closed on
Mar 23, 2006
Sold by
Winmark Hms Inc
Bought by
Morris Thomas E and Morris Jennifer J
Home Financials for this Owner
Home Financials are based on the most recent Mortgage that was taken out on this home.
Original Mortgage
$191,150
Interest Rate
6.75%
Mortgage Type
New Conventional
Purchase Details
Closed on
Sep 16, 2005
Sold by
Dagpau Inc
Bought by
Winmark Homes Inc
Purchase Details
Closed on
Apr 15, 2005
Sold by
Dagpau Inc
Bought by
Dagpau Inc
Purchase Details
Closed on
Nov 12, 2002
Bought by
Dagpau Inc
Create a Home Valuation Report for This Property
The Home Valuation Report is an in-depth analysis detailing your home's value as well as a comparison with similar homes in the area
Home Values in the Area
Average Home Value in this Area
Purchase History
| Date | Buyer | Sale Price | Title Company |
|---|---|---|---|
| Nieves Erika | -- | -- | |
| Nieves Erika | $238,700 | -- | |
| Morris Thomas E | $239,000 | -- | |
| Winmark Homes Inc | -- | -- | |
| Dagpau Inc | -- | -- | |
| Dagpau Inc | -- | -- |
Source: Public Records
Mortgage History
| Date | Status | Borrower | Loan Amount |
|---|---|---|---|
| Previous Owner | Nieves Erika | $234,351 | |
| Previous Owner | Morris Thomas E | $191,150 |
Source: Public Records
Tax History Compared to Growth
Tax History
| Year | Tax Paid | Tax Assessment Tax Assessment Total Assessment is a certain percentage of the fair market value that is determined by local assessors to be the total taxable value of land and additions on the property. | Land | Improvement |
|---|---|---|---|---|
| 2024 | $4,244 | $164,688 | $36,000 | $128,688 |
| 2023 | $4,230 | $164,688 | $36,000 | $128,688 |
| 2022 | $3,820 | $129,190 | $29,200 | $99,990 |
| 2021 | $3,563 | $112,499 | $24,000 | $88,499 |
| 2020 | $3,336 | $104,669 | $20,000 | $84,669 |
| 2019 | $3,262 | $100,838 | $20,000 | $80,838 |
| 2018 | $3,081 | $95,476 | $20,000 | $75,476 |
| 2017 | $2,298 | $78,936 | $20,000 | $58,936 |
| 2016 | $2,252 | $74,381 | $20,000 | $54,381 |
| 2015 | $2,274 | $74,974 | $20,000 | $54,974 |
| 2014 | $1,847 | $64,177 | $11,368 | $52,809 |
| 2013 | -- | $60,796 | $11,368 | $49,428 |
Source: Public Records
Map
Nearby Homes
- 1602 Sahale Falls Dr
- 2545 Olney Falls Dr
- 1208 Loowit Falls Ct
- 2560 Olney Falls Dr
- 6356 Mossy Oak Landing
- 2655 Old Winder Hwy
- 7062 Grand Hickory Dr
- 2651 Bald Cypress Dr
- 6834 White Walnut Way
- 747 Sienna Valley Dr
- 6905 White Walnut Way
- 2721 Bald Cypress Dr
- 6895 White Walnut Way
- 9036 Lexington Ct
- 2445 Retreat Point Pkwy
- 914 Rainsong Ct
- 908 Rainsong Ct
- 2302 Loowit Falls Dr
- 2304 Loowit Falls Dr Unit 3
- 2300 Loowit Falls Dr
- 2436 Fisk Falls Dr
- 2438 Fisk Falls Dr
- 2306 Loowit Falls Dr
- 2434 Fisk Falls Dr
- 1404 Kilchis Falls Way
- 1299 Loowit Falls Way
- 2308 Loowit Falls Dr
- 1401 Kilchis Falls Way
- 2432 Fisk Falls Dr
- 1301 Loowit Falls Way
- 1408 Kilchis Falls Way Unit 366
- 1408 Kilchis Falls Way
- 1403 Kilchis Falls Way
- 1403 Kilchis Falls Way
- 1397 Kilchis Falls Way
- 2307 Loowit Falls Dr
- 2307 Loowit Falls Dr